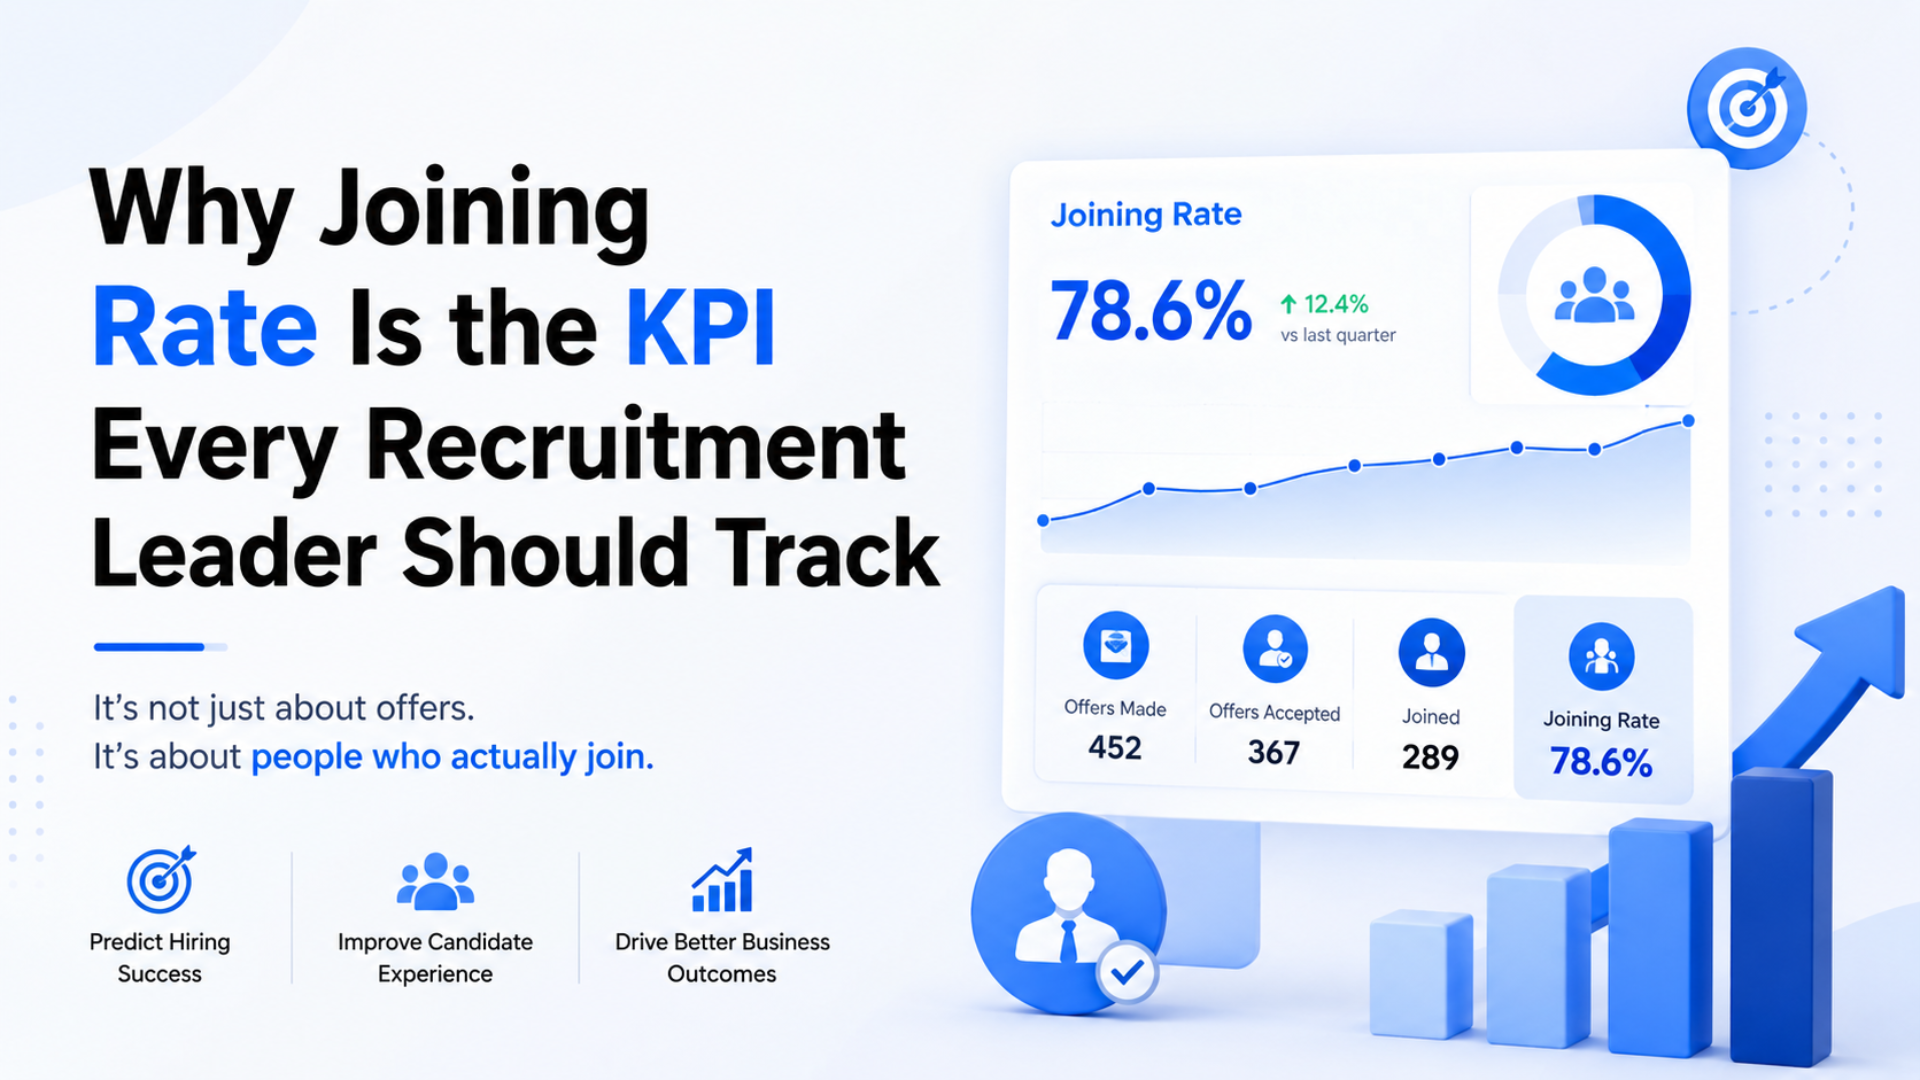
Your recruitment dashboard shows an offer acceptance rate of ninety-one percent. Your recruiting team is proud. Your hiring managers are satisfied. Your CFO is happy about the cost per hire. But buried in the data, if anyone bothered to look, is a number that tells a very different story: your joining rate is seventy-nine percent. For every ten candidates who sign your offer letter, two never show up. Those two ghosted candidates represent roughly forty thousand dollars in wasted recruiting spend this quarter alone. They represent six more weeks of vacancy for two hiring managers who thought their roles were filled. They represent a recruiting team that is working hard but not working smart, because the metric they are optimizing for does not measure the outcome the business actually needs. The gap between offer acceptance rate and joining rate is the most expensive blind spot in recruitment, and it persists because most recruitment leaders have never defined joining rate as a KPI, let alone built the systems to track and improve it.
This article makes the case for joining rate as the single most important KPI for recruitment leaders. It explains why the standard metrics, time to fill, cost per hire, and offer acceptance rate, all measure the wrong finish line. It provides a framework for calculating joining rate, breaking it down by segment, and using it to drive specific, targeted improvements in the recruiting process. And it demonstrates why the organizations that adopt joining rate as their primary KPI consistently outperform those that do not, not because they are better at sourcing or screening, but because they are better at the one thing that matters most: getting the candidates they have already closed to actually show up and start working. According to SHRM’s talent acquisition research, the average organization loses between fifteen and twenty-five
percent of accepted offers to pre-start withdrawals, representing billions of dollars in annual waste across the industry. A recruitment KPI joining rate makes this waste visible, measurable, and actionable.
The Problem with the Standard Recruiting Metrics
The three metrics that dominate recruitment dashboards, time to fill, cost per hire, and offer acceptance rate, all share a common flaw: they measure the process, not the outcome. Time to fill measures how fast the recruiting team moves a candidate through the pipeline. Cost per hire measures how much the organization spends per accepted offer. Offer acceptance rate measures how often candidates say yes to an offer. None of these metrics measures whether the candidate actually becomes a productive employee, which is the only outcome the business cares about. The problem is most acute with offer acceptance rate, which has become the de facto primary metric for most recruiting teams. Offer acceptance rate is easy to calculate, easy to benchmark, and easy to improve. A recruiter who closes more offers gets a higher acceptance rate. But a high acceptance rate is necessary but not sufficient for recruiting success. A recruiting team that achieves a ninety-five percent acceptance rate but only an eighty percent joining rate is losing fifteen percent of its wins to a failure mode that the primary metric does not even acknowledge. This is the core argument for joining rate vs offer acceptance rate: the acceptance rate tells you how good your team is at closing offers. The joining rate tells you how good your team is at producing actual hires. The business needs actual hires. According to McKinsey’s people organization insights, organizations that shift their primary metric from offer acceptance rate to joining rate within eighteen months achieve a ten to fifteen percent improvement in the true cost per productive hire, because the shift in metric drives a shift in behavior that reduces the most expensive failure mode in recruiting.
Cost per hire suffers from the same problem. The standard calculation divides total recruiting spend by the number of hires made. But "hires made" typically means "offers accepted," not "candidates who started." When fifteen to twenty-five percent of accepted offers never convert to starts, the reported cost per hire significantly understates the true cost. If an organization spends eight thousand dollars per accepted offer and twenty percent of offers never convert, the true cost per productive start is ten thousand dollars, twenty-five percent higher than the reported figure. This recruitment ROI measurement gap means that recruitment leaders are making budget and resource allocation decisions based on numbers that systematically overstate their team's effectiveness. The joining rate corrects this distortion by providing an accurate denominator: not offers accepted, but candidates who actually started. When the joining rate is factored into the cost per hire calculation, the resulting metric, true cost per productive start, gives a far more accurate picture of recruiting efficiency.
How to Calculate and Segment Joining Rate
The joining rate is calculated as the number of candidates who actually start employment divided by the number of offers accepted, measured over a defined period. The formula is simple. The implementation is where most organizations struggle, because it requires consistent
data tracking across multiple systems: the applicant tracking system for offers accepted, the HRIS system for actual start dates, and manual tracking for candidates who accepted an offer but never appeared in the HRIS because they withdrew before their start date. Once the baseline joining rate is established, the real insight comes from segmenting it. Joining rate should be broken down by at least five dimensions. First, by role level: senior, mid-level, and entry-level roles typically have very different joining rates, because senior candidates face more lucrative counteroffers and have more at stake in the transition. Second, by source: do candidates from referrals have a higher joining rate than candidates from job boards? If so, the question is not whether to invest more in referrals, but what makes the referral experience different and how to replicate it for other sources. Third, by recruiter: which recruiters consistently achieve the highest joining rates, and what are they doing differently? Fourth, by time in pipeline: do candidates who move through the process quickly have higher joining rates than those who take longer? Fifth, by geography and business unit: are there specific locations or teams where the joining rate is systematically lower? These segment-level insights drive targeted interventions that improve the overall joining rate far more efficiently than generic process improvements. According to LinkedIn’s recruiting resources, organizations that segment their joining rate by at least three dimensions identify improvement opportunities that are invisible in the aggregate number, and the interventions they deploy based on those insights typically improve the overall rate by fifteen to twenty percentage points within twelve months. This is the power of a well-implemented offer-to-start KPI.
The joining rate should also be tracked over time, as a rolling twelve-month metric, to distinguish between temporary fluctuations and structural trends. A single month's dip in the joining rate might be caused by a batch of counteroffers from a specific competitor. A sustained decline over three or more months indicates a systemic problem, such as a deteriorating candidate experience during the post-acceptance phase or a shift in the competitive landscape that is making retention offers more aggressive. The rolling view also smooths out the statistical noise that can distort monthly measurements, particularly for smaller recruiting teams that extend relatively few offers per month. As we have explored in our analysis of how many follow-ups one hire actually needs, the organizations that get the most value from joining rate data are the ones that track it consistently over time and use trend analysis to drive proactive improvements rather than reactive fixes.
What Joining Rate Reveals That Other Metrics Hide
Joining rate is not just another metric to add to the dashboard. It is a diagnostic tool that reveals problems that are invisible to the standard metrics. A declining joining rate, for example, can indicate any of several underlying issues. If the joining rate is declining while the offer acceptance rate is stable, the problem is in the post-acceptance experience. The team is good at closing offers but poor at maintaining candidate commitment during the notice period. If the joining rate is declining for senior roles but stable for mid-level roles, the problem is counteroffer resilience. Senior candidates are being retained by their current employers more successfully, and the post-acceptance strategy needs to be strengthened for that
segment. If the joining rate is declining for candidates sourced through job boards but stable for referral candidates, the problem is the quality of the pre-hire relationship. Job board candidates arrive with less trust and less connection to the organization, and the post-acceptance experience needs to compensate for this deficit. Each of these diagnoses leads to a different intervention, and the joining rate is the recruitment success metric that makes the correct diagnosis possible. Without it, recruitment leaders are guessing about the cause of their hiring failures and investing in solutions that may not address the actual problem. According to Gartner’s HR trends analysis, organizations that measure joining rate are three times more likely to correctly identify the root cause of a decline in hiring outcomes than organizations that rely solely on offer acceptance rate, because joining rate provides the diagnostic granularity that the aggregate metrics lack.
Joining rate also reveals the true cost of recruiting failures. When a recruitment leader can quantify the number of accepted offers that never convert to starts, and assign a dollar value to each failure based on the direct recruiting cost plus the indirect cost of the extended vacancy, they can make a compelling business case for investment in post-acceptance process improvements. A recruitment leader who can demonstrate that a twenty percent joining rate gap represents five hundred thousand dollars in annual waste has a far stronger case for additional resources than one who can only point to a subjective sense that "we lose too many candidates after they sign." This financial clarity is one of the most powerful arguments for adopting joining rate as a KPI: it translates a qualitative problem into a quantitative business case that resonates with CFOs and other senior leaders. As we have discussed in our analysis of why more tools produce the same hiring problems, the organizations that secure budget for recruiting improvements are the ones that can demonstrate the financial impact of the problem they are solving, and joining rate provides that demonstration.
How to Use Joining Rate to Drive Recruiting Performance
Once joining rate is established as a KPI, it becomes a powerful management tool. The most effective approach is to use it at three levels: organizational, team, and individual. At the organizational level, the joining rate is reported alongside the standard metrics on the executive dashboard, giving senior leaders visibility into the true effectiveness of the recruiting function. At the team level, the joining rate is broken down by recruiting team or region, creating healthy competition and identifying which teams are most effective at converting accepted offers into actual starts. At the individual level, the joining rate is incorporated into recruiter performance reviews, alongside offer acceptance rate and other standard metrics, creating accountability for the full outcome rather than just the close. The key to successful adoption is to frame joining rate not as a punitive metric but as a developmental one. Recruiters who have never been measured on joining rate will initially resist, because it adds a dimension of accountability that did not previously exist. The recruitment leader's job is to frame the metric as an opportunity: "This metric measures the full value of your work. You already do the hard part, sourcing, screening, interviewing, and closing. This metric ensures you get credit for the candidates who actually start, not just the ones who sign." This framing aligns the recruiter's
self-interest with the metric's purpose, which is to ensure that the recruiting team's effort produces the business outcome it was intended to produce. According to Deloitte’s talent research, organizations that introduce joining rate as a developmental metric, with coaching and support, see a faster and more sustained improvement than organizations that introduce it as a punitive metric, because the developmental approach drives engagement and experimentation rather than fear and gaming.
The joining rate also changes the conversation between the recruiting team and the hiring manager. When a vacancy remains unfilled after an accepted offer falls through, the hiring manager is frustrated. But when the recruiting team can point to a joining rate dashboard that shows the overall trend, the segment-level breakdown, and the specific interventions in progress, the conversation shifts from blame to collaboration. The hiring manager can see that the recruiting team is aware of the problem, measuring it, and working to improve it. They can also see their own role in the solution, because the segment-level data often reveals that hiring managers who are more engaged in the post-acceptance phase have higher joining rates. This creates a constructive feedback loop where the metric drives better behavior from both the recruiting team and the hiring manager. Understanding the difference between AI sourcing and AI recruiting, the organizations that achieve the best outcomes are the ones where joining rate creates shared accountability across all stakeholders, not just the recruiting team.
Building a Joining Rate Dashboard: What to Track and How
A joining rate dashboard should provide three layers of information. The first layer is the headline metric: the overall joining rate for the current month, the rolling twelve-month average, and the trend direction. This gives the recruitment leader an at-a-glance view of the recruiting function's true effectiveness. The second layer is the segment breakdown: joining rate by role level, by source, by recruiter, by geography, and by business unit. This layer reveals where the problem is concentrated and where the improvement opportunity is largest. The third layer is the diagnostic layer: for each segment where the joining rate is below target, the dashboard shows the likely causes, based on the pattern of withdrawals and the available context data. For example, if the senior-engineering segment shows a declining joining rate and the withdrawal data shows that sixty percent of withdrawals mention counteroffers, the diagnostic layer highlights counteroffer prevention as the priority intervention for that segment. Building this dashboard requires data integration across the applicant tracking system, the HRIS, and the communication platform. Most organizations have the data but have never connected it in a way that makes the joining rate calculable. An AI platform that spans the entire candidate journey, from sourcing through onboarding, provides this integration automatically. This is what distinguishes an agentic AI recruiting platform from a collection of point solutions: the ability to measure the outcome that matters, joining rate, across the entire process, and to provide the diagnostic insights needed to improve it. As we have explored in our analysis of why referrals outperform cold outreach, the data often reveals that the highest-performing segment is not the one with the most sourcing investment but the one with the
strongest post-acceptance experience, which means the joining rate dashboard can redirect investment toward the interventions that produce the highest return.
Why Huntlo.ai Makes Joining Rate a First-Class Metric
Huntlo.ai provides the complete joining rate measurement and optimization infrastructure that recruitment leaders need. The platform tracks every accepted offer through to the start date, calculates the joining rate in real time, and breaks it down by every segment that matters: role level, source, recruiter, geography, and business unit. It provides the diagnostic layer that identifies the likely causes of joining rate declines and recommends targeted interventions based on the specific pattern of withdrawals in each segment. The platform also ensures that outdated candidate data in AI recruiting tools never undermines the accuracy of the joining rate calculation, because every data point is continuously refreshed from the organization's systems of record. For recruitment leaders who are ready to stop flying blind on the most expensive failure mode in recruiting, Huntlo provides the visibility, the diagnostics, and the intervention toolkit to transform joining rate from an unknown unknown into a managed, improving metric. The platform also helps organizations understand how to evaluate an AI sourcing tool before buying, by demonstrating that the most valuable recruiting technology is the kind that measures and improves the outcomes the business actually needs, not just the activities the recruiting team performs. When your dashboard shows a joining rate of ninety-five percent, your recruiting team is not just performing well. They are delivering the one outcome the business cannot do without: people who show up, contribute, and stay.