Every recruiting leader who has ever proposed an AI sourcing tool purchase has faced the same question from finance, leadership, or partners: "What's the return on investment?" And every time, the answer has been some combination of hand-waving, vendor case studies, and vague promises about efficiency gains. That approach doesn't work anymore. In an era of tightening budgets and heightened scrutiny on every dollar of technology spend, you need a rigorous, defensible ROI model that speaks the language of the people holding the purse strings.
This guide teaches you how to build that model from scratch. Not a generic template with made-up numbers, but a personalized calculator grounded in your actual recruiting data, your actual costs, and your actual hiring outcomes. By the time you finish, you'll have a spreadsheet that tells you — in dollars and cents — exactly what an AI sourcing tool like Huntlo will save or earn for your organization.
Why You Need Your Own Calculator (Not a Vendor's)
AI recruiting tool vendors are happy to provide ROI calculators on their websites. These tools ask you a few questions and spit out an impressive-sounding savings figure. The problem is that these calculators are marketing tools, not analytical tools. They're designed to produce large, compelling numbers that drive purchases, not to give you an honest assessment of value.
Vendor calculators typically overestimate savings in several ways. They often assume ideal adoption rates — every feature used by every recruiter every day — when real-world adoption is usually far lower. They sometimes use industry-average metrics that may not reflect your specific situation. And they almost never account for the learning curve, change management costs, or the possibility that the tool won't perform as well for your specific use cases as it does in vendor demonstrations.
Building your own calculator eliminates these biases. You use your own data, your own assumptions, and your own cost structure. The result is an ROI model that you can defend in a budget meeting because you built it, you understand every input and assumption, and you can adjust it on the fly when someone challenges your numbers.
Understanding the Two ROI Contexts: Revenue and Cost
Before building anything, you need to understand that recruiting ROI looks fundamentally different depending on whether recruiting is a revenue center or a cost center in your organization. This distinction drives every formula and metric in your calculator.
For staffing agencies and recruiting firms, recruiting is a revenue center. Every placement generates a fee. The ROI question is: "Does this tool help us make more placements, higher-value placements, or faster placements that increase our total revenue?" The calculator for a staffing agency measures revenue impact — additional placements, higher fill rates, reduced time-to-revenue, and improved recruiter productivity that translates directly to the bottom line.
For internal HR departments and talent acquisition teams, recruiting is a cost center. The ROI question is: "Does this tool reduce our total cost of hiring, including recruiter time, vacancy costs, advertising spend, and bad-hire costs?" The calculator for an HR department measures cost reduction — lower cost-per-hire, shorter time-to-fill, reduced job advertising spend, and fewer costly mis-hires.
Both calculators share some common inputs, but the output metrics and the way you present the business case differ significantly. We'll build both versions.
Step 1: Establish Your Baseline Metrics
Every ROI calculation starts with a baseline — a clear picture of your current recruiting performance without the AI tool. You need hard numbers here, not estimates. Pull these from your ATS, your financial records, or whatever system you use to track recruiting activity.
The core baseline metrics you need are:
Monthly hiring volume — How many positions do you fill per month on average? Look at the last 6-12 months to get a stable average, not a single month that might be unusually high or low. For a staffing agency, this is monthly placements. For an HR department, this is monthly new hires.
Average time to fill — How many days from job requisition to accepted offer? Again, use a 6-12 month average. This metric matters because every day a position is vacant has a cost, whether it's lost agency revenue or lost organizational productivity.
Cost per hire — For agencies, this includes recruiter compensation, tool subscriptions, job board spending, and overhead allocated to recruiting. For HR departments, use the SHRM formula: (total recruiting costs / total hires). Industry averages range from $4,000-$5,000 for straightforward roles to $15,000-$30,000+ for specialized positions.
Sourcing time per hire — How many hours does a recruiter spend sourcing candidates for each hire? This includes searching platforms, reviewing profiles, and building candidate lists before any outreach happens. Most recruiters underestimate this number. Time yourself or your team for a week to get an accurate measurement.
Outreach conversion rate — What percentage of candidates you reach out to respond? And of those who respond, what percentage become qualified candidates who move forward in the process? These conversion rates determine how much outreach volume you need to generate a qualified candidate pipeline.
Offer acceptance rate — What percentage of candidates who receive offers actually accept? A low acceptance rate indicates problems with candidate experience, compensation alignment, or competitor offers — problems that faster time-to-fill (which AI tools enable) can help address.
Bad hire rate — What percentage of new hires don't work out within the first year? The cost of a bad hire typically ranges from 30% to 200% of the employee's annual salary, depending on the role and how quickly the failure is caught.
Gather these numbers before touching a single spreadsheet cell. The accuracy of your ROI calculator depends entirely on the accuracy of your baseline data.
Step 2: Quantify Your Current Recruiting Costs
With baseline metrics in hand, the next step is to translate those metrics into dollar costs. This is where the ROI calculator starts taking shape.
For Staffing Agencies: Total Monthly Recruiting Cost
Calculate your total monthly recruiting cost by adding:
Recruiter compensation (salary + benefits + overhead per recruiter, multiplied by the number of recruiters)
Tooling costs (LinkedIn Recruiter, ATS, job boards, email tools, and any other subscriptions)
Job advertising spend (paid job postings, sponsored listings, programmatic advertising)
Administrative and overhead costs (office space, management, support staff allocated to recruiting)
For example, a three-recruiter agency might have:
Recruiter compensation: $7,500/month × 3 = $22,500
Tooling costs: $500/month
Job advertising: $1,200/month
Administrative overhead: $3,000/month
Total monthly recruiting cost: $27,200
Then calculate your monthly recruiting revenue:
Average placements per month: 7
Average placement fee: $14,000
Monthly placement revenue: $98,000
Your baseline monthly profit from recruiting is revenue minus cost: $98,000 - $27,200 = $70,800. This is the number your AI tool investment needs to improve.
For HR Departments: Total Monthly Hiring Cost
Calculate your total monthly hiring cost by adding:
Internal recruiter and coordinator compensation (full cost including benefits)
External recruiter or agency fees (if you use them for hard-to-fill roles)
Job advertising and job board spending
ATS and recruiting tool subscriptions
Background check and assessment costs
Interview and selection costs (interviewer time valued at their hourly rate)
Onboarding costs (training, equipment, productivity ramp-up)
For example, an HR department making 12 hires per month might have:
Internal TA team cost: $18,000/month
External agency fees: $4,000/month (for 2-3 hard-to-fill roles)
Job advertising: $2,500/month
Tool subscriptions: $800/month
Background checks and assessments: $1,200/month
Interview time costs: $5,000/month
Total monthly hiring cost: $31,500
This translates to an average cost per hire of $2,625, which is on the low end — many organizations find their actual cost per hire is significantly higher once they account for all the components.
Step 3: Model the AI Tool's Impact on Each Metric
This is where the calculator gets specific. For each baseline metric, you need to estimate how the AI tool will change it. Be conservative. Vendor claims of 300% improvement are marketing; realistic expectations based on industry data are more modest but still compelling.
Sourcing Time Reduction: 50-70%
AI sourcing tools dramatically reduce the time recruiters spend finding candidates. A task that currently takes a recruiter 4-6 hours — searching LinkedIn, Indeed, and other platforms, reviewing dozens of profiles, and building a candidate shortlist — takes an AI tool like Huntlo approximately 10-20 minutes. That's a 90%+ time reduction for the sourcing task itself.
However, your overall sourcing time reduction will be less dramatic because not all of a recruiter's day is spent on active sourcing. A typical recruiter might spend 30-40% of their time on sourcing activities. If AI reduces that 35% of their day by 80%, the overall time savings is approximately 28% of the recruiter's total work time.
For your calculator, use a conservative estimate of 40-50% reduction in sourcing-specific time, translating to a 15-20% overall productivity improvement for the recruiter.
Time-to-Fill Reduction: 30-50%
Faster sourcing, faster outreach, and faster screening all compound to reduce time-to-fill. Industry benchmarks from organizations that have implemented AI sourcing tools report time-to-fill reductions of 30-50% for standard professional roles and 20-35% for specialized roles where candidate scarcity is the primary bottleneck.
For your calculator, use 30% as a conservative estimate and 40% as a moderate estimate. Apply this to your baseline time-to-fill to calculate the reduced time-to-fill with the AI tool.
Outreach Volume Increase: 200-400%
This is the multiplier that surprises most people. A recruiter sending 30-50 personalized messages per day manually can send 200-500 AI-automated messages per day across multiple channels. Huntlo's multi-channel capability (email, LinkedIn, WhatsApp, AI voice) means outreach volume isn't limited by the recruiter's typing speed or attention span.
However, more outreach doesn't automatically mean more placements. The quality of AI-generated outreach versus human-crafted outreach, and the candidate's response to automated versus personal messages, affect the actual conversion. Conservative estimates suggest that even accounting for lower per-message response rates, the net increase in qualified candidate conversations is 40-80%.
Placement Volume Increase (Agencies): 25-50%
The bottom-line metric for agencies: how many more placements can you make? The increase comes from faster time-to-fill (you can take on more job orders), broader sourcing reach (you find candidates others miss), and higher conversion rates (multi-channel outreach reaches candidates who don't respond to a single channel).
Conservative estimates based on agency case studies suggest a 25-35% increase in placement volume within 3-6 months of AI tool adoption, with some agencies reporting 50%+ increases as they optimize their workflows.
Cost-Per-Hire Reduction (HR Departments): 25-40%
For HR departments, AI tools reduce cost-per-hire through several mechanisms: lower job advertising spend (AI sources candidates directly instead of waiting for applications), reduced agency fees (more roles filled internally with AI sourcing), and lower recruiter time-per-hire (automated screening and outreach reduce hours invested per position).
A conservative model suggests 25% cost-per-hire reduction, while organizations that fully leverage AI capabilities and reduce their reliance on external agencies can see 35-40% reductions.
Step 4: Build the Calculator — Agency Version
Now let's construct the actual calculator. You can build this in any spreadsheet application — Excel, Google Sheets, or any tool that supports formulas.
Section A: Input Variables
Create a section labeled "Inputs" with the following fields (using your actual baseline data):
Monthly placements (current): 7
Average placement fee: $14,000
Number of recruiters: 3
Monthly recruiter cost per person (full cost): $7,500
Monthly tooling costs (current): $500
Monthly job advertising spend ( $1,200
AI tool monthly cost: $99 per seat
Estimated placement volume increase from AI: 30% (conservative)
Section B: Current State Calculations
Monthly placement revenue: Monthly placements × Average placement fee = 7 × $14,000 = $98,000
Monthly total cost: (Recruiter cost × Number of recruiters) + Current tooling + Job advertising = ($7,500 × 3) + $500 + $1,200 = $24,200
Monthly net profit: Revenue - Total cost = $98,000 - $24,200 = $73,800
Cost per placement: Total cost ÷ Monthly placements = $24,200 ÷ 7 = $3,457
Section C: Projected State With AI Tool
Monthly placements with AI: Current placements × (1 + Volume increase %) = 7 × 1.30 = 9.1 placements
Monthly placement revenue with AI: 9.1 × $14,000 = $127,400
Monthly total cost with AI: (Recruiter cost × Number of recruiters) + Current tooling + AI tool cost + Job advertising = $22,500 + $500 + $297 + $1,200 = $24,497
Monthly net profit with AI: $127,400 - $24,497 = $102,903
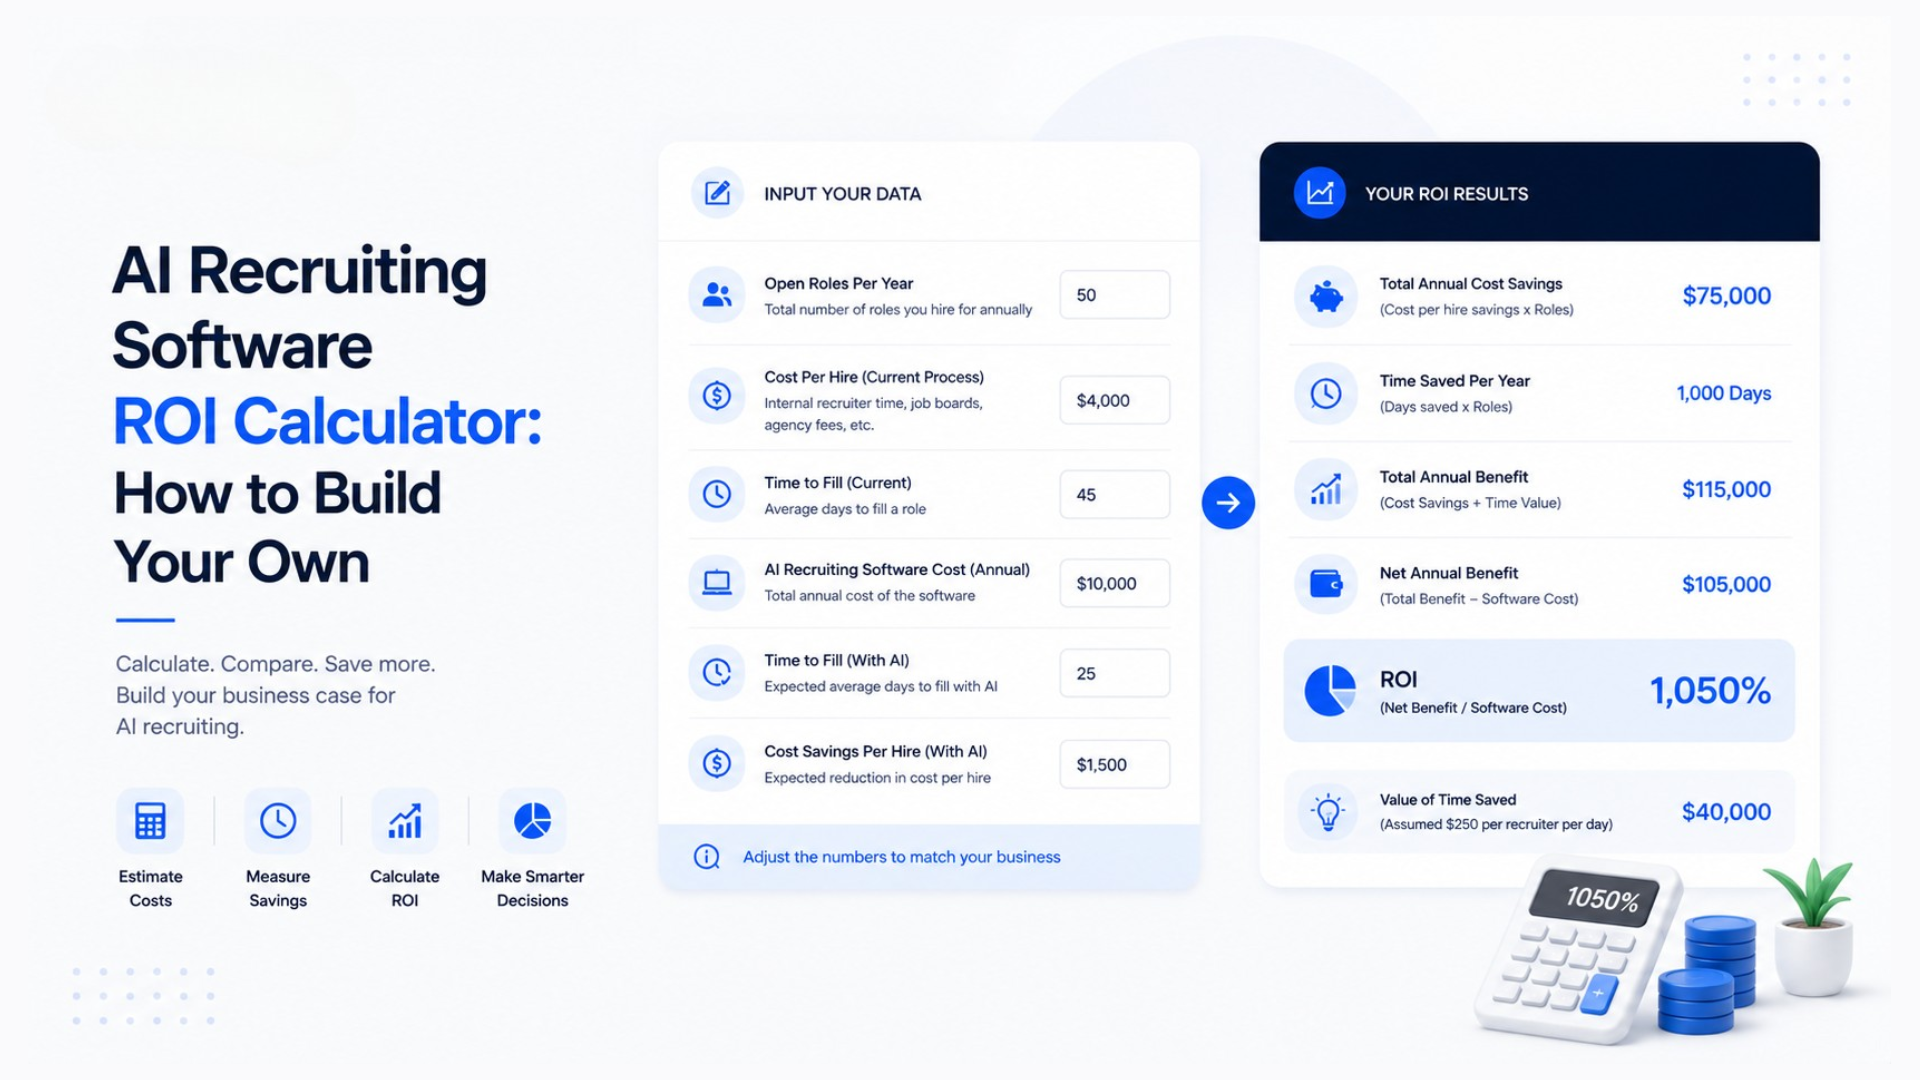
Section D: ROI Calculations
Monthly profit increase: Profit with AI - Current profit = $102,903 - $73,800 = $29,103
Annual profit increase: Monthly increase × 12 = $29,103 × 12 = $349,236
Monthly AI tool cost: $99 × 3 seats = $297
Monthly ROI: (Monthly profit increase - Monthly AI cost) ÷ Monthly AI cost × 100 = ($29,103 - $297) ÷ $297 × 100 = 9,698%
Annual ROI: Same calculation annualized = ($349,236 - $3,564) ÷ $3,564 × 100 = 9,698%
Payback period: Monthly AI cost ÷ Monthly profit increase = $297 ÷ $29,103 = less than 1 day
These numbers illustrate why AI sourcing tools are such a compelling investment for agencies. Even using conservative assumptions — just 30% placement volume increase — the ROI is extraordinary. The tool pays for itself within the first day of the first month.
Sensitivity Analysis
The key to a credible calculator is showing how the results change under different assumptions. Add a sensitivity table that shows projected profit at different placement volume increase percentages:
At 20% increase: 8.4 placements, $110,320 revenue, $105,120 annual profit increase
At 30% increase: 9.1 placements, $127,400 revenue, $349,236 annual profit increase
At 40% increase: 9.8 placements, $144,200 revenue, $593,352 annual profit increase
At 50% increase: 10.5 placements, $161,000 revenue, $837,468 annual profit increase
This range shows that even under pessimistic assumptions (only 20% improvement), the AI tool generates over $100,000 in additional annual profit on a $3,564 annual investment. Under moderate assumptions, the return is nearly 100 times the cost.
Step 5: Build the Calculator — HR Department Version
The HR version follows the same structure but measures cost reduction rather than revenue increase.
Section A: Input Variables
Monthly new hires: 12
Current cost per hire: $2,625 (from our earlier calculation)
Total monthly hiring cost: $31,500
Current average time to fill: 42 days
AI tool monthly cost: $99 per seat (assuming 2 TA team members use it)
Estimated cost-per-hire reduction: 25% (conservative)
Estimated time-to-fill reduction: 30% (conservative)
Average daily vacancy cost per role: $500 (based on role importance)
Section B: Current State
Total annual hiring cost: $31,500 × 12 = $378,000
Total annual vacancy cost: (Monthly hires × Time to fill in months × Daily vacancy cost × Working days) = (12 × 1.82 × $500 × 22) = $240,240
Total annual hiring-related cost: $378,000 + $240,240 = $618,240
Section C: Projected State With AI Tool
New cost per hire: $2,625 × 0.75 = $1,969 (25% reduction)
New time to fill: 42 × 0.70 = 29.4 days (30% reduction)
Monthly AI tool cost: $99 × 2 = $198
Total annual hiring cost with AI: ($1,969 × 12 × 12) + ($198 × 12) = $283,152 + $2,376 = $285,528
Total annual vacancy cost with AI: (12 × 1.32 × $500 × 22) = $174,240
Total annual hiring-related cost with AI: $285,528 + $174,240 = $459,768
Section D: ROI Calculations
Annual cost savings: $618,240 - $459,768 = $158,472
Annual AI tool cost: $198 × 12 = $2,376
Net annual savings: $158,472 - $2,376 = $156,096
ROI: $156,096 ÷ $2,376 × 100 = 6,568%
Payback period: $2,376 ÷ ($158,472 ÷ 12) = $2,376 ÷ $13,206 = less than 1 week
Again, the numbers are compelling. Even before accounting for qualitative benefits like improved candidate experience, better recruiter satisfaction, and reduced burnout, the pure financial case for AI sourcing tools in an HR department is overwhelmingly positive.
Step 6: Factor in Hidden Savings That Most Calculators Miss
The basic calculations above cover the direct, easily measurable financial impacts. But there are several hidden savings that can significantly increase the actual ROI, and including them in your calculator makes your business case even stronger.
Reduced Bad Hire Costs
If your AI screening tool improves candidate assessment quality — and conversational AI screening tools like Huntlo's typically do, because they evaluate candidates more thoroughly and consistently than time-pressed human screeners — your bad hire rate should decrease. Even a 10-15% reduction in bad hires produces substantial savings.
Calculate it: Current bad hire rate × Annual hires × Average cost of a bad hire. For an organization making 150 hires per year with a 10% bad hire rate and an average bad-hire cost of $25,000 (a conservative figure for professional roles), the annual bad-hire cost is $375,000. A 15% reduction saves $56,250 per year.
Reduced Recruiter Turnover Costs
Recruiter burnout is a massive hidden cost in the industry. Recruiters who spend their days on repetitive sourcing and screening tasks burn out faster than those who focus on high-value relationship work. AI tools that automate the repetitive tasks can reduce recruiter turnover by 20-30%, and each avoided turnover event saves $20,000-$50,000 in recruiting, training, and lost productivity costs.
Improved Offer Acceptance Rate
Faster time-to-fill means candidates are less likely to receive competing offers during your hiring process. If your current offer acceptance rate is 75% and AI tools help you improve it to 85%, every percentage point improvement reduces wasted sourcing and screening costs for candidates who ultimately don't accept.
Talent Pool Compound Value
Every candidate sourced and screened by the AI tool who isn't placed in the current role gets added to your talent pool. Over 12 months, this pool grows into a proprietary asset that accelerates future hiring. Huntlo's talent pool management system is specifically designed to capture this compound value, automatically tagging and organizing candidates for future matching. While difficult to quantify precisely, the value of a growing talent pool increases with every search you run.
Step 7: Account for Implementation and Adoption Costs
A credible ROI calculator must include costs, not just benefits. The main costs to account for are:
Implementation time: The hours your team spends setting up the tool, configuring integrations, and learning the platform. For a tool like Huntlo with webhook-based ATS integration, implementation typically takes 2-5 hours. Value this time at your recruiter's hourly rate.
Training time: Even intuitive tools require some learning. Budget 5-10 hours per recruiter for initial training and workflow adaptation. Again, value this at the recruiter's hourly rate.
Productivity dip during transition: There's typically a 2-4 week period where recruiter productivity dips slightly as they adjust to the new tool. Calculate this as a percentage reduction in normal output during the transition period.
Ongoing management: AI tools require periodic attention — reviewing AI screening accuracy, adjusting outreach templates, managing talent pool tags. Budget 1-2 hours per week per recruiter for ongoing optimization.
For most organizations, these costs total $2,000-$5,000 in the first month and $500-$1,000 per month thereafter. Include them in your calculator as "one-time implementation costs" and "ongoing management costs" and subtract them from the gross savings to get net savings.
Step 8: Build Your Presentation Layer
The calculator is only useful if you can present it clearly to decision-makers. Structure your presentation around three key outputs:
First, the payback period. This is the single most important number for most decision-makers. How long until the tool pays for itself? For AI sourcing tools priced under $200 per month, the payback period is typically measured in days, not months. Being able to say "this tool pays for itself in the first week" is far more powerful than any feature demonstration.
Second, the 12-month net financial impact. This is the total dollar savings or revenue increase over the first year, after subtracting all costs including tool subscription, implementation, and ongoing management. Present this as a single, clear number: "This tool will generate $156,000 in net savings over the next 12 months."
Third, the sensitivity range. Show best-case, expected-case, and worst-case scenarios. Decision-makers respect analysis that acknowledges uncertainty. If your worst-case scenario still shows positive ROI, the decision becomes much easier to justify.
Step 9: Validate and Refine
After building your calculator, validate it against reality. If you've already purchased an AI tool, compare your calculator's projections against actual results after 3 months. If you haven't purchased yet, ask vendors for case studies from organizations similar to yours and compare their reported results to your projections.
Refine your assumptions based on this validation. If your calculator predicted a 30% placement increase but you're seeing 20%, adjust the model. If time-to-fill reduction is better than projected, update that too. The calculator is a living document that should be revisited quarterly as real data accumulates.
The One-Page Summary: Quick Reference Formulas
For easy reference, here are the core formulas that power your ROI calculator:
Monthly profit increase (Agency) = (Current monthly placements × Estimated volume increase %) × Average placement fee - Monthly AI tool cost
Annual cost savings (HR) = (Current annual hiring cost × Estimated cost-per-hire reduction %) + (Current annual vacancy cost × Estimated time-to-fill reduction %) - Annual AI tool cost
Payback period = Monthly AI tool cost ÷ Monthly net savings
ROI percentage = (Annual net savings ÷ Annual AI tool cost) × 100
Net cost per hire with AI = (Current cost per hire × (1 - Cost reduction %)) + (Monthly AI tool cost per recruiter ÷ Monthly hires per recruiter)
These formulas work with any AI recruiting tool. Just plug in the tool's actual monthly cost and your estimated impact percentages to get your personalized ROI projections.
Making the Business Case: Beyond the Numbers
While the financial case for AI sourcing tools is overwhelmingly strong, the best business cases include non-financial benefits that resonate with different stakeholders. For the CFO, it's the 6,000%+ ROI and sub-one-week payback period. For the VP of Talent Acquisition, it's the ability to handle 30% more requisitions without adding headcount. For hiring managers, it's faster time-to-fill and more qualified candidate shortlists. For the candidates themselves, it's faster response times and a more engaging application experience.
When you present your calculator, lead with the financial numbers but don't stop there. Show how the tool addresses the specific pain points of each stakeholder in the room. The financial model gets you in the door; the holistic value proposition gets you the signature.
AI sourcing tools like Huntlo, priced at $99 per seat per month, represent one of the highest-ROI technology investments available to recruiting organizations today. The question isn't whether you can afford to invest in AI sourcing — it's whether you can afford not to. And with a rigorous ROI calculator built on your own data, you can prove it.