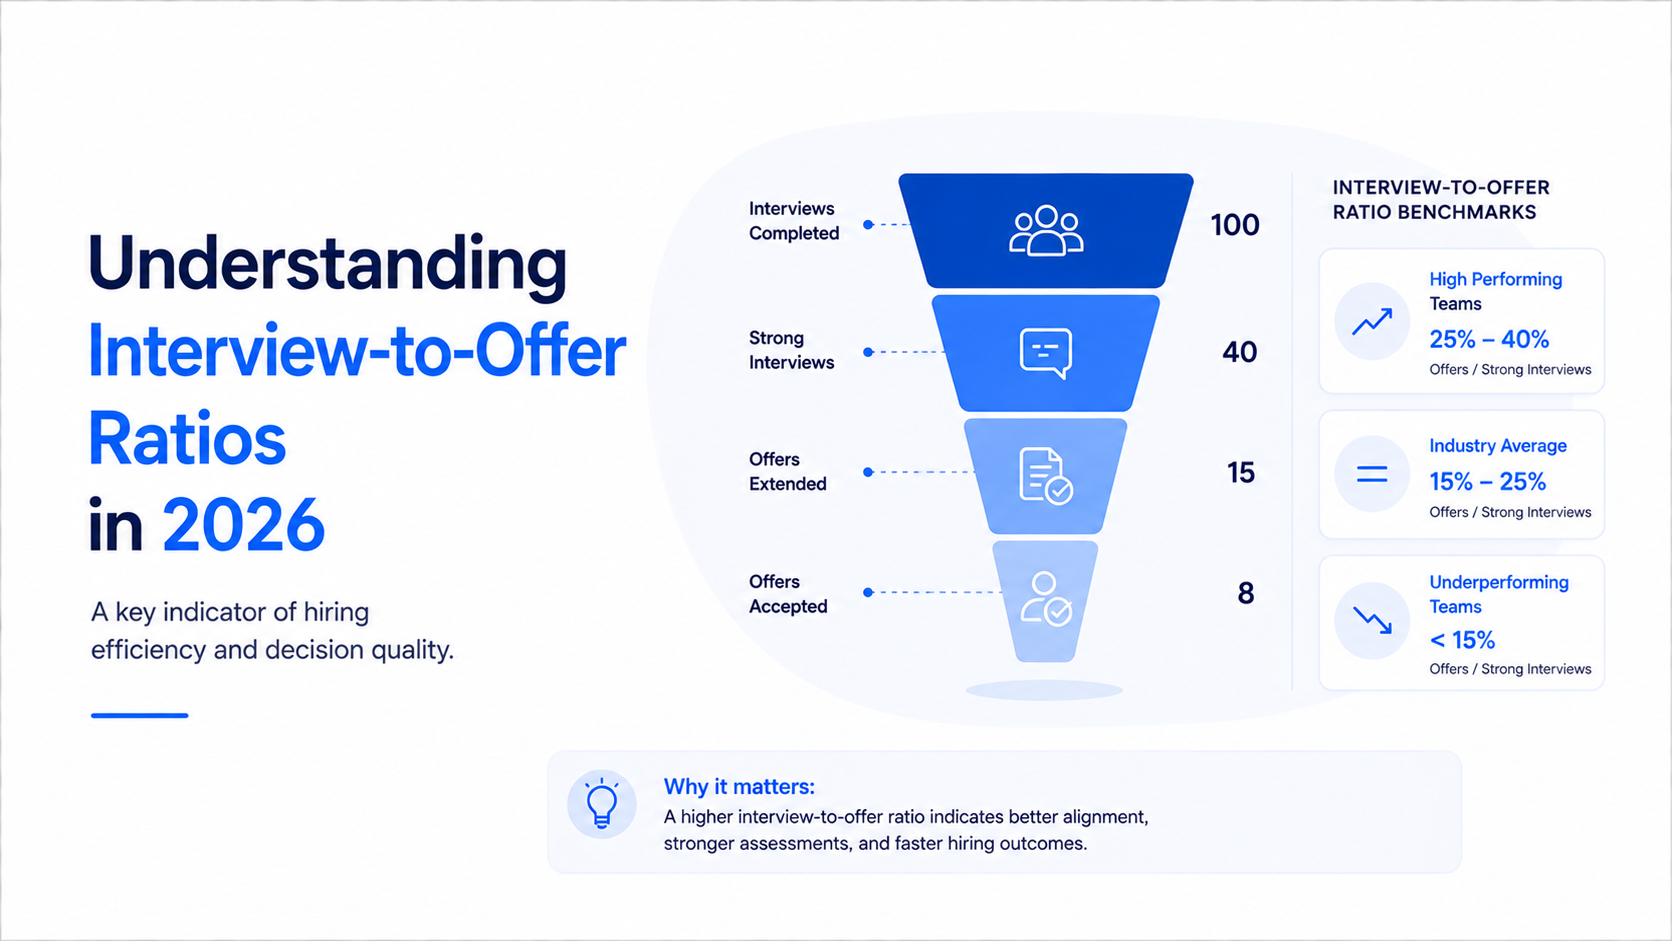
If there is one recruiting metric that is universally tracked and almost universally misinterpreted, it is the interview-to-offer ratio. The number itself is simple: how many candidates did you interview for every offer you extended? Most TA teams calculate it without a second thought and use it as a rough efficiency indicator. A low ratio feels good—fewer interviews per offer means the team is closing faster. A high ratio feels bad—lots of interviews with little to show for it. But this surface-level reading misses almost everything that makes this metric valuable. The interview-to-offer ratio is not primarily an efficiency measure. It is a diagnostic tool that reveals the alignment between your sourcing quality, your evaluation criteria, and your hiring standards. When interpreted correctly, it exposes problems that are invisible in every other metric. This post breaks down what the interview-to-offer ratio actually measures, what the healthy ranges look like, and how to use it as the diagnostic instrument it was designed to be.
What Interview-to-Offer Ratio Actually Measures
At its core, the interview-to-offer ratio measures the efficiency of your candidate evaluation process. It tells you how much interview capacity your organization consumes to produce one hireable candidate. But the ratio is influenced by every stage that precedes the interview, which means it functions as a composite indicator of sourcing quality, screening accuracy, job requirement clarity, and hiring manager alignment. A high ratio—say, 8:1 or higher—does not necessarily mean your interview process is broken. It might mean your sourcing is sending underqualified candidates into the interview pipeline. It might mean your screening criteria are too loose. It might mean the job requirements are unrealistic for the current market. Each of these root causes produces the same symptom—a high interview-to-offer ratio—but each requires a completely different fix.
McKinsey talent acquisition research emphasizes that the interview-to-offer ratio should be analyzed in conjunction with the metrics that precede it in the funnel. A company with a high ratio but a strong screening-to-interview conversion rate likely has a sourcing problem—good screening, but not enough qualified candidates entering the pipeline. A company with a high ratio and a low screening-to-interview conversion rate likely has both a sourcing and a screening problem. A company with a high ratio but strong sourcing and screening numbers likely has an evaluation problem—the interview process itself is not producing confident hiring decisions. This chain of analysis is what turns a single number into a diagnostic framework.
The ratio also reflects the degree of consensus within the hiring process. In organizations where hiring managers and recruiters are closely aligned on candidate requirements before interviews begin, the interview-to-offer ratio tends to be lower because the team is evaluating against a clear, shared standard. Gartner research on hiring process effectiveness found that organizations with formal candidate scorecards and pre-interview calibration sessions have interview-to-offer ratios 30 to 40 percent lower than organizations where interviewers evaluate candidates independently against their own criteria. The ratio, in this context, is not measuring candidate quality. It is measuring process alignment.
Healthy Ranges by Role Type and Seniority
The interview-to-offer ratio varies significantly by role type, and applying a single benchmark across all roles is one of the most common mistakes TA teams make. For professional and individual contributor roles—software engineers, marketing specialists, financial analysts—the typical healthy range falls between 3:1 and 5:1. This means the team interviews three to five candidates for every offer extended. For senior individual contributor roles and mid-level management positions, the range typically shifts to 4:1 and 7:1, reflecting the higher stakes and more rigorous evaluation these roles require. For executive and C-suite positions, the ratio commonly falls between 5:1 and 10:1, though specialized executive searches can legitimately exceed this range due to the narrow talent pool and the high cost of a mis-hire at this level.
SHRM benchmarking data provides additional granularity by industry. Technology companies, particularly those hiring software engineers in competitive markets, often operate in the 3:1 to 4:1 range because the talent pool is relatively deep and the evaluation process is highly structured. Healthcare organizations hiring specialized clinical roles frequently see ratios in the 6:1 to 8:1 range because the required credentials and experience combinations are narrow. Retail and hospitality companies hiring for high-volume, lower-complexity roles often operate below 3:1 because the screening process does most of the heavy lifting and interviews serve primarily as a cultural fit check. The key insight is that these ranges reflect the nature of the roles and markets, not the quality of the recruiting team.
Company size also has a measurable impact. Deloitte workforce analytics data shows that companies with fewer than 500 employees typically have higher interview-to-offer ratios—often 1.5 to 2 points higher—than companies with more than 5,000 employees. This is partly because smaller companies have less brand recognition, which means their sourcing generates fewer pre-qualified candidates, and partly because they have less formalized interview processes, which means interviewers are more likely to disagree on candidate quality, leading to more interviews per decision. Understanding where your company falls on these dimensions—role type, industry, and size—is essential before you can determine whether your ratio is healthy or problematic.
What a High Ratio Really Means
A high interview-to-offer ratio—generally above 6:1 for professional roles—is a symptom, not a disease. The disease could be any one of several underlying conditions, and treating the symptom without diagnosing the disease is the most common mistake TA teams make when they encounter this number. The first and most frequent root cause is unrealistic job requirements. When a hiring manager insists on a candidate profile that does not exist in the market—ten years of experience in a technology that has only existed for seven, expertise in five unrelated skill domains, or a compensation range 20 percent below market rate—the interview-to-offer ratio will be high regardless of how well the recruiting process is managed. The team will interview many candidates, find that none match the impossible specification, and either extend offers to compromises or keep searching indefinitely.
LinkedIn talent market data shows that over-specification of job requirements is the single largest driver of high interview-to-offer ratios in professional hiring. In technology roles, the average job posting lists 30 to 40 percent more requirements than the hired candidate actually possesses, suggesting that the hiring process spends significant time interviewing candidates who were never going to meet the full specification. The solution is not more interviews. It is a more honest conversation between the recruiter and the hiring manager about what is truly required versus what is merely desirable. Recruiters who push back on over-specified requirements—using market data to demonstrate what is available at the given compensation level—consistently reduce interview-to-offer ratios by 20 to 30 percent without any degradation in quality of hire.
The second most common root cause is poor sourcing-channel alignment. When the majority of candidates entering the interview pipeline come from channels that are not optimized for the role type—using job boards for senior specialist roles, or employee referrals for high-volume entry-level hiring where the referral network cannot scale—the interview-to-offer ratio will suffer. Evaluating your sourcing tools and channel performance against interview-to-offer outcomes by role type reveals whether your sourcing strategy is feeding the right candidates into the evaluation process. When teams using AI sourcing tools compare their interview-to-offer ratios before and after implementation, they frequently find that the improvement comes not from better interviewing but from better-matched candidates entering the pipeline in the first place.
What a Low Ratio Can Hide
A low interview-to-offer ratio feels like a success metric, and in many cases it is. A ratio of 2:1 or below generally indicates that the sourcing and screening process is highly effective at identifying qualified candidates, and that the interview process is producing confident, aligned decisions. But an extremely low ratio can also signal problems that are less obvious but equally damaging. The most common hidden risk of a very low ratio is over-reliance on a narrow definition of qualification, which can lead to a homogeneous team that lacks diversity of thought, experience, and perspective. When the interview process consistently produces quick consensus around a very specific candidate profile, it may be functioning more as a confirmation bias engine than as an evaluation process.
EY research on technology hiring specifically warns that interview-to-offer ratios below 2:1 for technical roles can indicate that the interview process is not sufficiently rigorous. If nearly every candidate who interviews receives an offer, it suggests that the interview is functioning as a formality rather than a genuine assessment. This can happen when the screening process is extremely strict—which has its own problems of filtering out qualified candidates—or when the interview panel lacks the skills or structure to differentiate between candidates of varying quality. In either case, the low ratio is masking a process weakness that will eventually manifest as quality-of-hire problems.
Another hidden risk of an artificially low ratio is offer-stage decline concentration. If the team is extending offers to nearly every interviewed candidate but a large percentage of those offers are declined, the effective interview-to-hire ratio may be far less impressive than the interview-to-offer ratio suggests. A team with a 2:1 interview-to-offer ratio and a 40 percent offer decline rate has an effective interview-to-hire ratio of 5:1—which is worse than a team with a 4:1 interview-to-offer ratio and a 90 percent acceptance rate. This is why the interview-to-offer ratio should always be analyzed alongside offer acceptance rate. Together, these two metrics provide a complete picture of how efficiently the interview and offer stages are converting interested candidates into actual hires.
How Interview Structure Affects the Ratio
The structure of the interview process has a direct and measurable impact on the interview-to-offer ratio, and this is one of the most actionable levers available to TA teams. Structured interviews—where every candidate for a given role is asked the same set of predetermined questions and evaluated against the same scoring rubric—produce significantly more consistent hiring decisions than unstructured interviews, where each interviewer asks different questions based on their own judgment. McKinsey meta-analysis of hiring process research shows that structured interviews improve the predictive validity of hiring decisions by 30 to 50 percent compared to unstructured interviews, which translates directly to more confident offer decisions and lower interview-to-offer ratios.
The number of interview rounds also has a significant effect. Each additional round of interviews adds a filter that can reduce the number of candidates reaching the offer stage, but the marginal predictive value of additional rounds diminishes rapidly. Gartner data on hiring process design suggests that the optimal number of interview rounds for most professional roles is between three and four. Teams that have streamlined their processes from six or seven rounds down to three or four report interview-to-offer ratios that are 20 to 35 percent lower, primarily because the shorter process reduces candidate fatigue and withdrawal. Candidates who endure five or more interview rounds are significantly more likely to withdraw or accept competing offers before the process concludes, which inflates the ratio by adding interview events that never produce an offer.
Interview panel composition is a third structural factor. Panels that include a mix of skills and perspectives—technical assessment, cultural fit evaluation, cross-functional stakeholder input—produce more well-rounded candidate evaluations and more confident hiring decisions than homogeneous panels. SHRM research on interview effectiveness recommends panels of three to five interviewers with clearly defined evaluation criteria for each panelist. When interviewers know exactly what they are assessing—technical skills for one panelist, leadership potential for another, cultural alignment for a third—the evaluations are more focused, the feedback is more actionable, and the hiring decision is reached with greater confidence. This confidence directly reduces the number of additional interviews needed to reach an offer decision.
Using the Ratio to Diagnose Process Problems
The interview-to-offer ratio becomes truly valuable when it is used as the entry point for a structured diagnostic process. The first step is to calculate the ratio not just at the aggregate level but segmented by role type, business unit, hiring manager, and recruiter. This segmentation almost always reveals variation that the aggregate number hides. A company-wide ratio of 5:1 might mask a 3:1 ratio for engineering, a 7:1 ratio for sales, and a 4:1 ratio for finance. Each of these segments tells a different story and requires a different intervention. The engineering ratio looks healthy. The sales ratio suggests a sourcing or requirement problem. The finance ratio is within range but might still have room for improvement.
The second step is to correlate the interview-to-offer ratio with the metrics that surround it in the funnel. Deloitte workforce analytics recommends analyzing four relationships simultaneously. First, the ratio between sourcing volume and screening pass rate, which reveals whether the problem starts before the interview stage. Second, the ratio between screening pass rate and interview-to-offer rate, which reveals whether the screening process is preparing well-qualified candidates for the interview stage. Third, the ratio between interview-to-offer rate and offer acceptance rate, which reveals whether the offers being extended are competitive and compelling. Fourth, the ratio between offer acceptance rate and first-year retention, which reveals whether the candidates being selected are actually the right fit for the role and organization.
This four-point diagnostic framework turns a single metric into a comprehensive process assessment. When TA leaders present this analysis to their hiring managers, the conversation shifts from "we need to interview more candidates" to "our screening-to-interview conversion is strong, but our interview-to-offer ratio is high for sales roles, which suggests we need to revisit the job requirements or improve our interview evaluation criteria." This is the kind of specific, actionable insight that agentic AI platforms can generate at scale by analyzing patterns across thousands of candidates and dozens of role types simultaneously—identifying the specific segments where the ratio is deviating and surfacing the most likely root causes.
The Relationship Between Ratio and Quality of Hire
One of the most debated questions in recruiting analytics is whether a lower interview-to-offer ratio correlates with higher quality of hire. The intuitive assumption is that a more selective process—with a higher ratio—produces better hires because the team is evaluating more candidates before making a decision. The data tells a more nuanced story. McKinsey research found that the relationship between interview-to-offer ratio and quality of hire follows a U-shaped curve. At very low ratios, quality of hire tends to be lower because the process is not sufficiently selective. As the ratio increases into the 3:1 to 5:1 range, quality of hire improves and peaks. But as the ratio climbs above 7:1 or 8:1, quality of hire begins to decline again.
The reason for this decline at high ratios is that excessively long interview processes tend to lose the best candidates. Top performers in any field are typically interviewing with multiple companies simultaneously. When your process takes six weeks and requires seven interview rounds, the strongest candidates—the ones with the most options—withdraw or accept other offers before you make a decision. You are left with the candidates who had fewer alternatives, which often—but not always—correlates with lower overall caliber. This dynamic means that optimizing the interview-to-offer ratio is not about pushing it as low as possible. It is about finding the sweet spot where the process is thorough enough to ensure quality but efficient enough to retain the candidates you want most.
LinkedIn talent research confirms that the highest quality-of-hire scores are consistently associated with interview-to-offer ratios in the 3:1 to 5:1 range for professional roles. Companies operating in this range make confident, well-supported hiring decisions without subjecting candidates to a process that tests their patience. The practical implication for TA teams is clear: if your ratio is above 6:1, the path to better quality of hire is not more interviews. It is fixing the upstream problems—sourcing, screening, and requirement definition—that are forcing the team to interview too many candidates to find one worth hiring. Teams that stack more tools without addressing these root causes often find their ratio unchanged because the underlying process problem remains intact.
How to Improve Your Interview-to-Offer Ratio
Improving the interview-to-offer ratio requires identifying which of the root causes described above is driving your specific number and then targeting the intervention accordingly. If the primary driver is unrealistic job requirements, the fix is a structured calibration conversation with the hiring manager, supported by market data on candidate availability and compensation benchmarks. If the primary driver is poor sourcing-channel alignment, the fix is reallocating sourcing investment toward the channels that produce candidates who pass the interview stage at the highest rate. If the primary driver is unstructured interviews that produce inconsistent evaluations, the fix is implementing structured interview guides, scoring rubrics, and calibration sessions.
Gartner recommends a simple prioritization framework for teams looking to improve their ratio. Start with the intervention that requires the least investment and targets the most likely root cause. For most teams, that is a job-requirements calibration exercise—sitting down with hiring managers, reviewing the current specification against market data, separating mandatory requirements from nice-to-haves, and testing the revised specification against the existing candidate pipeline. This exercise typically takes two to four hours per role and can reduce the interview-to-offer ratio by 1 to 2 points within a single hiring cycle. If that does not produce sufficient improvement, move to the next intervention: interview process restructuring, then sourcing-channel optimization, and finally tool investment.
The key principle is measurement before action. Before implementing any change, calculate your current interview-to-offer ratio segmented by role type and document the baseline. After implementing the change, measure the ratio again after a full hiring cycle and compare the results. This before-and-after comparison is what transforms opinions about what works into evidence about what works. The TA teams that consistently maintain healthy interview-to-offer ratios are not the ones with the biggest budgets or the strongest employer brands. They are the ones that measure rigorously, diagnose specifically, intervene targetedly, and iterate continuously. Over time, this disciplined approach compounds into a significant competitive advantage in hiring efficiency and quality.