Why Recruitment Analytics Matters Now
The hiring environment has changed dramatically. According to Greenhouse's 2026 Hiring Benchmarks Report, applications per recruiter have surged from 146 in 2022 to 746 in 2025 — a 411% increase. Meanwhile, the average number of recruiters per organization has dropped from 10.43 to 4.62 — a 56% decrease. Recruiters are managing five times as many applications with half as many people.
The result is a productivity paradox. Despite the volume surge, monthly hires per recruiter have more than doubled from 2.2 in 2022 to 4.9 in 2025. But time-to-fill has stretched from 43.64 days to 59.67 days. Recruiters are working harder and closing more roles, yet each hire takes longer. The system is strained to breaking.
This is where analytics becomes essential. Without data, teams optimize for activity — more resumes reviewed, more calls made, more interviews scheduled. With the right metrics, they optimize for outcomes — the right candidates found faster, the best offers accepted, the highest-quality hires retained.
The Three Tiers of Recruitment Metrics
Not all metrics deserve equal attention. The most effective recruiting teams organize their analytics into three tiers based on how often the metric changes and what decisions it drives.
Tier One: Funnel Health Metrics (Weekly Review)
These metrics change fast and signal immediate problems or opportunities. They should be reviewed weekly, automated wherever possible, and paired with specific actions.
Time-to-hire measures days from a candidate entering the pipeline to accepting the offer. According to TrueCalling's 2026 recruiting metrics analysis, a healthy benchmark for skilled roles in 2026 is 25 to 35 days. Manual single-channel sourcing often runs 50-plus days. The metric matters because every day a role sits open is a day of lost productivity, and the best candidates accept fast.
Time-to-fill is broader — days from requisition opening to offer accepted. It includes internal approval bottlenecks that can account for 20 to 30% of total fill time. This is the number hiring managers feel, and it is often where the most politically sensitive conversations happen.
Response rate is the share of contacted candidates who reply. This is the quiet killer of recruiting throughput. According to Pin's recruitment funnel benchmarks, LinkedIn InMail sits around 15%. Multichannel outreach with AI personalization — especially over WhatsApp — clears 40%. Doubling response rate halves how many people you need to contact for the same number of hires.
Conversion rate per stage tracks the percentage that advances from each stage to the next: contacted to replied, replied to screened, screened to interviewed, interviewed to offer, offer to hire. Stage-by-stage conversion shows exactly where the pipeline leaks instead of just the top and bottom numbers.
According to Pin's 2026 funnel data, the funnel narrows fast. Only 6% of job views become applications. Only 3% of applicants get interviews. And 27% of interviewees get hired. That works out to roughly 1 hire per 180 applicants. The biggest leak is at the screening stage — 97% of applicants are eliminated before they speak with a human.
Tier Two: Quality and Cost Metrics (Monthly Review)
These metrics change more slowly and reveal structural patterns. They should be reviewed monthly, benchmarked against historical performance, and used to adjust strategy.
Quality of hire is the most strategically significant metric and, by a wide margin, the hardest one to measure well. According to Testlify's 2026 recruitment KPIs guide, a LinkedIn survey found that Quality of Hire is considered the single most valuable KPI by 40% of talent acquisition professionals, outranking Time to Fill, Cost Per Hire, and every other metric. Yet fewer than a third of organizations have a consistent, documented method for measuring it.
The cost of ignoring it is high. The U.S. Department of Labor estimates that a bad hire can cost up to 30% of the employee's first-year earnings. SHRM puts that figure higher, suggesting the total cost can reach 50 to 60% of annual salary for mid-level roles and 200% or more for senior leadership positions.
There is no universal formula, but the most effective models combine weighted signals: performance rating at 90 days and 6 months (35 to 40%), 12-month retention (25 to 30%), hiring manager satisfaction score (15 to 20%), speed to full productivity (10 to 15%), and peer cultural fit rating (5 to 10%).
Cost per hire only becomes genuinely useful when read alongside Quality of Hire. A $2,000 hire who exits in six months is dramatically more expensive than a $15,000 hire who stays for five years and exceeds expectations. Teams that optimize cost per hire in isolation consistently cut corners on sourcing and assessment, then wonder why retention and performance suffer.
Source of hire identifies which channels produce the best outcomes. When tracked accurately, the findings consistently challenge conventional wisdom. Research from iCIMS and LinkedIn suggests that employee referrals produce 30 to 50% of all hires while consuming only 5 to 10% of total sourcing spend. Referral hires have a first-year retention rate 45% higher than hires from job boards. Meanwhile, job board spend consumes 30 to 40% of most external recruiting budgets but produces a disproportionately low share of high-quality, long-tenure hires.
The emerging standard in 2026 is multi-touch attribution, which credits all channels a candidate engaged with before applying, rather than just the last one. This requires UTM parameters on all digital sourcing links, integration between careers site analytics and the ATS, and a consistent tagging taxonomy.
Offer acceptance rate is the final checkpoint in the funnel. According to Metaview's 2026 recruiting benchmarks, the healthy range is 85 to 95%. Below 70% is a crisis state indicating systemic misalignment between what you are offering and what the market expects. Every declined offer should be followed by structured tracking of the primary reason: compensation, competing offer, role fit concerns, process experience, location or flexibility, or employer brand.
Tier Three: Strategic Metrics (Quarterly Review)
These metrics change slowly and inform long-term strategy. They should be reviewed quarterly with senior leadership and used to justify budget, technology, and organizational decisions.
Hiring manager satisfaction measures how satisfied internal stakeholders are with the recruiting function. According to Metaview's benchmarks, the healthy target is NPS 30-plus or 4.0-plus on a 5-point scale. Low scores predict downstream pain: hiring managers stop using the TA team and start sourcing their own candidates or pushing for agency spend.
Candidate experience score quantifies how candidates perceive the recruitment process. The most widely adopted approach is candidate Net Promoter Score, adapted from customer experience methodology. Candidates are asked: on a scale of 0 to 10, how likely are you to recommend applying to this company to a friend or colleague? Responses segment into promoters (9 to 10), passives (7 to 8), and detractors (0 to 6).
According to Starred's 2026 recruitment KPIs analysis, a high cNPS indicates positive candidate experience and strong employer brand. The rejection-stage measurement is the real signal — a candidate who declines and still gives a 7-plus NPS is a candidate who will refer friends. Top-decile teams hit NPS 50-plus at both offer and rejection stages.
Diversity hiring rate tracks the effectiveness of diversity-focused recruitment efforts by measuring the proportion of hires from underrepresented backgrounds. This metric requires careful definition — what constitutes underrepresented varies by organization, geography, and role level — but it is increasingly essential for compliance, culture, and competitive positioning.
How to Build a Recruitment Analytics Dashboard That Gets Used
A dashboard nobody opens is worse than no dashboard, because it implies a control you do not have. Three rules keep analytics alive in an organization.
Match the Cadence to the Metric
Funnel-health metrics like response rate and stage conversion should be reviewed weekly. Cost and quality metrics like cost per hire and quality of hire should be reviewed monthly. Strategic metrics like source of hire trends and diversity hiring rate should be reviewed quarterly. Reporting everything at the same interval guarantees most of it will be ignored.
Pair Every Metric with an Owner and an Action
A number with no decision attached is decoration. Response rate dropped below 30% — review channel mix. Time-to-hire exceeded 45 days for engineering roles — audit scheduling bottlenecks. Offer acceptance rate fell below 80% — analyze decline reasons and adjust compensation bands. The metric only matters when it triggers a specific behavior.
Let the Tooling Capture the Data
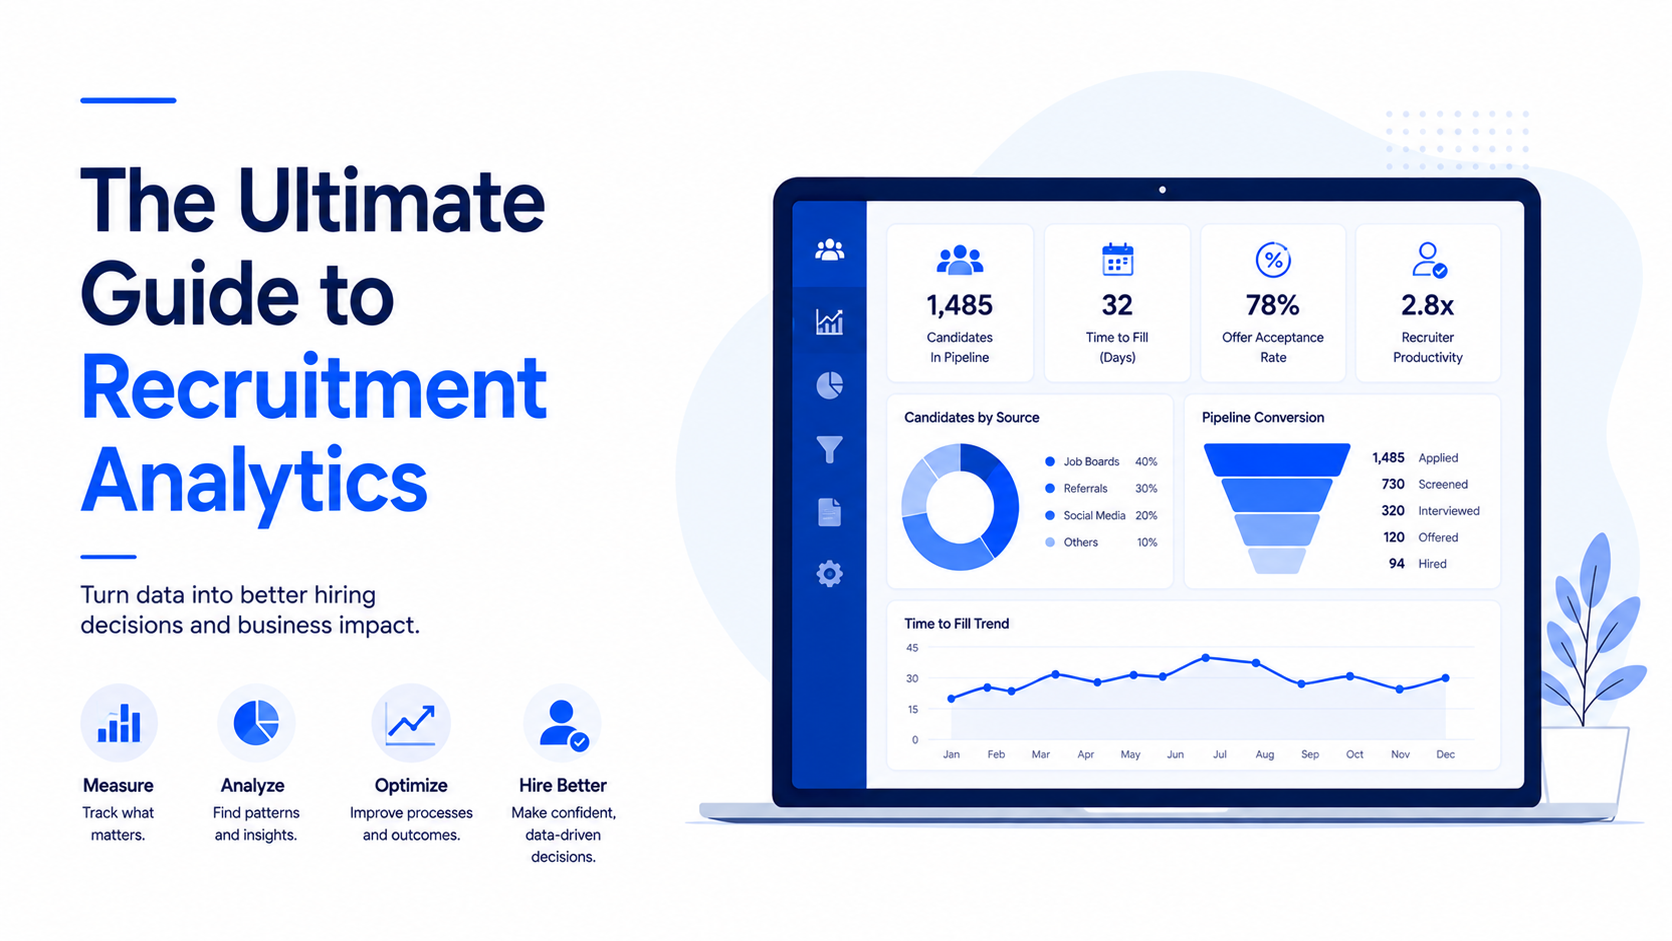
If a recruiter has to log touchpoints by hand, the data will be late and wrong. Metrics are only as good as the system that records them automatically. Modern AI recruiting platforms capture sourcing activity, outreach engagement, screening outcomes, and scheduling data without manual entry. The best systems feed this data directly into dashboards that update in real time.
The Industry Benchmarks That Matter
Benchmarks provide context for your own numbers. But the most important benchmark is your own historical performance, tracked consistently over time.
According to Metaview's 2026 recruiting benchmarks, here are the healthy ranges for key metrics:
Time to fill: 30 to 45 days for individual contributors, 45 to 75 days for managers and directors, 90-plus days for VP and executive searches
Time to hire: 18 to 30 days
Offer acceptance rate: 85 to 95%
Funnel conversion — application to onsite: 10 to 20%
Quality of hire: 75%-plus rated meeting or exceeding expectations
Source of hire: referrals 30%+, sourced 30%+
Cost per hire: $4,000 to $15,000 (varies significantly by role and industry)
Interview-to-offer ratio: 3 to 4 interviews per offer
Recruiter productivity: 8 to 15 hires per recruiter per quarter
Hiring manager satisfaction: NPS 30-plus
Candidate experience: NPS 30-plus at offer stage, 0-plus at rejection stage
According to PageUp People's global benchmark data, the global average shows 11 applicants per role with a 1% applicant-to-hire rate, 6 candidates per role with a 4.7% candidate-to-hire rate, and a 28% offer acceptance rate. These averages vary dramatically by industry, geography, and role type, which is why internal benchmarking matters more than external comparison.
How AI Is Reshaping Recruitment Analytics
The biggest change in recruitment analytics is not new metrics. It is new data sources and new speed.
Traditional analytics relied on manual data entry, quarterly reporting, and lagging indicators. Modern AI recruiting platforms generate real-time data on candidate engagement, conversation quality, and pipeline health without human logging. This shifts analytics from reporting to prediction.
AI-powered sourcing platforms track which channels produce the highest-quality candidates, not just the most applications. They measure response rates by message type, channel, and candidate segment in real time. They identify which screening questions best predict interview success. They flag which interviewers have the highest calibration accuracy and which questions are most predictive of job performance.
According to TrueCalling's analysis, AI sourcing typically lifts recruiter productivity 2 to 3x by removing manual search and first-draft outreach. Sourcing-to-shortlist time drops from days to minutes. Response rates on multichannel AI-personalized outreach clear 40%, compared to 15% on standard InMail.
This creates a new class of predictive metrics. Instead of asking how many hires we made last quarter, teams can ask which candidates in our pipeline are most likely to accept an offer, which sources are most likely to produce high-quality hires, and which roles are at risk of missing their fill date.
The Three Metrics to Start With
If you are building a recruitment analytics function from scratch, do not try to instrument everything at once. Begin with three metrics that compound: time-to-hire as the headline outcome, response rate as the biggest efficiency lever, and quality of hire as the metric that keeps speed honest.
Get those three trustworthy and acted upon, then layer in the rest. The right AI recruiting software will capture most of them automatically without manual logging. The wrong approach is to build a dashboard with twenty metrics that nobody reviews.
Time-to-hire tells you if your process is fast enough to win competitive candidates. Response rate tells you if your outreach is effective enough to fill the pipeline. Quality of hire tells you if the people you are hiring are actually delivering value. Together, they form a complete picture of recruiting performance: speed, efficiency, and outcome.
Common Analytics Mistakes to Avoid
The most common mistake is optimizing cost per hire in isolation. A team that cuts sourcing spend, reduces assessment rigor, and speeds up interviews will see cost per hire drop — and quality of hire plummet six months later. The metric that matters is cost per quality hire, not cost per hire.
The second most common mistake is tracking vanity metrics. Number of resumes reviewed, number of calls made, number of interviews scheduled — these measure activity, not outcomes. A recruiter who reviews 200 resumes in a day feels productive. But if the screening method is flawed, that productivity is an illusion.
The third mistake is treating all roles with the same benchmarks. A 30-day time-to-fill is excellent for a customer service coordinator and concerning for a machine learning engineer. Set job category benchmarks, not a single company-wide target. Your ATS should calculate this automatically and alert when specific roles breach category thresholds.
The fourth mistake is ignoring candidate experience data until it becomes a crisis. By the time your candidate NPS drops below zero, your employer brand is already damaged. The candidates who had negative experiences have told their friends, left reviews on Glassdoor, and chosen your competitors. Candidate experience should be tracked continuously, not surveyed annually.
The Bottom Line
Recruitment analytics is not a reporting chore. It is how you turn hiring from an art into a managed system. In 2026, the data finally exists. The teams that act on it fill roles faster, hire better, and spend less proving it.
The key is to start with outcomes, not activity. Track time-to-hire to ensure speed. Track response rate to ensure pipeline health. Track quality of hire to ensure the people you bring in actually deliver value. Build from there, match the cadence to the metric, pair every number with an owner and an action, and let the tooling capture the data automatically.
The future belongs to recruiting teams that do not just measure what happened. They predict what will happen and prescribe what to do about it. That is the difference between analytics that decorates slides and analytics that drives decisions.