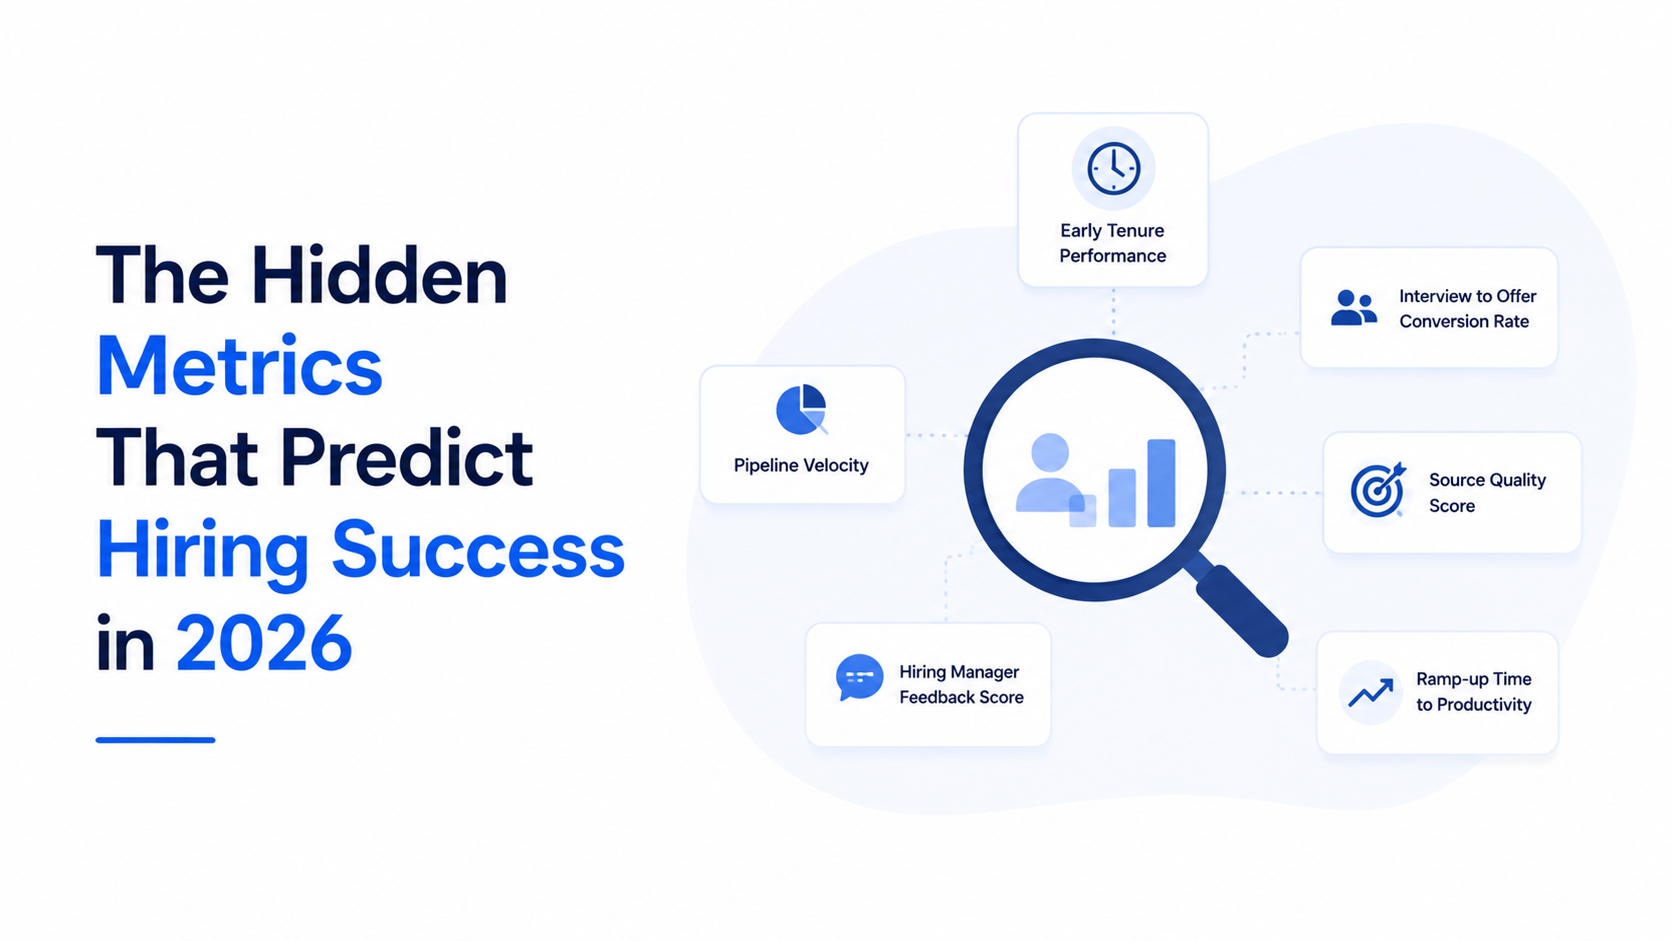
Every recruiting team knows the drill. You pull up your dashboard, check time-to-fill, glance at cost-per-hire, and maybe look at offer acceptance rate before heading into your weekly standup. These metrics feel productive. They give you numbers to report and trends to track. But here is the uncomfortable truth: none of them tell you whether the person you just hired is going to succeed. You can fill a requisition in 21 days at a bargain cost and still end up with a hire who underperforms, disengages, or leaves within six months. The metrics that actually predict hiring success operate on a completely different plane. They are not about speed or spend—they are about signal. They reveal whether a candidate is genuinely aligned with the role, whether your sourcing channels are producing people who thrive, and whether your interview process is identifying the right attributes. In this post, we uncover the hidden metrics that the most data-driven TA teams are using to predict hiring outcomes before the offer letter is ever signed.
Why Standard Hiring Metrics Miss What Actually Matters
Standard recruiting metrics were designed for a different era. They emerged when talent acquisition was viewed primarily as an operational function—measured by throughput and cost efficiency. Time-to-fill told you how quickly the requisition pipeline was moving. Cost-per-hire told you whether the recruiting budget was under control. Offer acceptance rate told you whether your compensation was competitive. These metrics are not worthless. They serve a purpose. But they were never designed to answer the question that matters most: "Will this person perform?" According to research from McKinsey, only about one-third of hiring decisions today are based on predictive data rather than intuition, which means the vast majority of companies are flying blind on the outcome that matters most.
The fundamental problem with standard metrics is that they are lagging indicators dressed up as real-time data. By the time you realize your time-to-fill has improved but your quality of hire has dropped, you have already made a batch of poor hiring decisions. The damage is done. What TA teams need are leading indicators—metrics that surface early in the hiring process and correlate strongly with long-term outcomes. These hidden metrics exist, but they require a different way of thinking about what to measure. Instead of asking "How fast are we hiring?" the question becomes "How strong are the signals we are collecting at each stage of the process?"
This shift from lagging to leading indicators is what separates recruiting teams that consistently build high-performing workforces from those that simply fill seats. Gartner has identified that organizations using predictive hiring metrics are 2.5 times more likely to improve their quality-of-hire scores year over year compared to those relying solely on operational metrics. The hidden metrics covered in this post are not theoretical. They are practical, measurable, and directly tied to hiring outcomes. They just require a willingness to look beyond the standard dashboard.
Candidate Engagement Score: The Early Signal Nobody Tracks
Candidate engagement score is one of the most powerful predictors of hiring success, yet it remains almost entirely absent from standard recruiting dashboards. The concept is straightforward: it measures how actively and consistently a candidate interacts with your hiring process. This includes response time to outreach emails, the number of interactions before applying, completion rates for assessments or take-home assignments, and the quality of questions candidates ask during interviews. A candidate who responds within hours, completes every stage of the process thoughtfully, and asks detailed questions about the role is demonstrating a level of engagement that strongly correlates with subsequent job performance and retention.
The data behind this metric is compelling. LinkedIn talent reports consistently show that highly engaged candidates—those who demonstrate sustained interest throughout the process—are 30 to 40 percent more likely to remain with the company beyond their first year compared to passively responsive candidates. The logic is intuitive: engagement in the hiring process reflects genuine interest in the role and the company, which translates to motivation and commitment once the person is on the job. Conversely, candidates who ghost mid-process, delay responses by days, or provide surface-level answers are often signaling a lack of genuine investment that tends to persist after they are hired.
Building a candidate engagement score does not require a new tool. It requires tracking behaviors that are already visible in your ATS and email systems. Assign points for fast response times, subtract points for missed deadlines or incomplete applications, weight interview question quality based on hiring manager feedback, and aggregate the score at each pipeline stage. The result is a single number that gives you a predictive signal about each candidate's likelihood of success. Teams already using agentic AI platforms are automating this scoring, making it possible to rank candidates by engagement without adding manual workload to their recruiting teams.
Sourcing Channel Quality Over Volume
Most TA teams measure source of hire by volume: how many candidates came from LinkedIn, how many from referrals, how many from job boards. Volume is useful for understanding where your pipeline is coming from, but it says nothing about whether those sources are producing successful hires. A channel that delivers 200 applicants but yields zero strong performers is a liability, not an asset. The hidden metric that matters is source quality—measured by the performance, retention, and ramp-up speed of hires from each channel, not the number of applications it generates.
SHRM benchmarking data consistently shows that employee referrals produce the highest-quality hires across nearly every industry, but referral programs are often underfunded because TA leaders cannot prove their ROI with volume-based metrics. When you measure source quality instead, the picture changes dramatically. A referral source with a 90 percent first-year retention rate and an average performance rating in the top quartile is exponentially more valuable than a job board source that produces ten times the volume but only 60 percent retention and average performance. The cost of early turnover alone—often estimated at 50 to 200 percent of annual salary—makes source quality the metric that should drive every sourcing budget decision.
The practical challenge is that source quality data requires cross-system visibility. You need to connect hiring source data from your ATS with performance data from your HRIS and retention data from your HR operations team. This is exactly where most TA teams hit a wall, often because they are stacking more tools without solving the underlying data integration problem. The teams that solve this challenge—whether through unified analytics platforms or custom data pipelines—are the ones that can prove to their CEOs exactly which sourcing channels are driving business outcomes and which are draining budget without delivering results.
Interview-to-Offer Ratio and What It Really Reveals
The interview-to-offer ratio is a metric most teams track but almost none interpret correctly. It is typically used as an efficiency indicator: a low ratio suggests the team is closing candidates quickly, while a high ratio suggests the funnel is leaky. But the hidden insight in this metric is not about efficiency—it is about the quality of your candidate evaluation process. An unusually low interview-to-offer ratio—one where nearly every interviewed candidate receives an offer—often signals that the screening process upstream is doing its job. But an unusually high ratio, where dozens of candidates are interviewed for a single hire, can indicate that the team lacks clear evaluation criteria, the job description is misaligned with market reality, or the sourcing channels are generating the wrong caliber of candidates.
The relationship between interview-to-offer ratio and hiring success is not linear. Deloitte workforce analytics research suggests that the optimal interview-to-offer ratio for most knowledge-worker roles falls between 3:1 and 5:1. Ratios below this range may indicate over-reliance on initial screening, potentially missing qualified candidates. Ratios above this range suggest process inefficiency that frustrates both candidates and hiring managers. The key is to track this ratio alongside quality-of-hire data for each role type, which reveals the sweet spot where your process is thorough enough to ensure quality but efficient enough to avoid candidate fatigue and offer-stage drop-offs.
When this ratio starts climbing without a corresponding improvement in quality of hire, it is one of the earliest warning signs that something in the process is broken. Perhaps the job requirements have drifted from what the market can supply. Perhaps hiring managers are not aligning on candidate evaluation criteria before interviews begin. Perhaps the AI sourcing tools feeding the pipeline need recalibration. Whatever the root cause, monitoring interview-to-offer ratio as a leading indicator—rather than a retrospective efficiency metric—gives TA leaders the ability to diagnose process problems before they cascade into poor hiring outcomes.
Ramp Time as a Predictor of Long-Term Performance
Ramp time—the number of months it takes a new hire to reach full productivity—is rarely tracked by recruiting teams because it is viewed as an onboarding metric rather than a hiring metric. This is a mistake. Ramp time is one of the strongest predictors of long-term performance, and the recruiting process has more influence over it than most TA leaders realize. A hire who reaches full productivity in two months was likely well-matched to the role, clearly informed about expectations during the interview process, and culturally aligned with the team. A hire who takes six months—or never fully ramps—is often a sign of a mismatch that could have been detected earlier with better evaluation criteria.
EY research on technology hiring specifically highlights ramp time as a critical but overlooked metric, noting that in fast-moving sectors, a three-month delay in productivity can cost a company the equivalent of an entire quarter's expected output from that role. For sales positions, the cost is even more direct: every month a sales rep is not fully ramped is a month of missed quota. When TA teams begin tracking ramp time by hire source, by interview panel composition, and by assessment scores, they uncover patterns that allow them to optimize for faster onboarding before the hire is even made. For example, if candidates who score above a certain threshold on a technical assessment consistently ramp 30 percent faster, that threshold becomes a data-driven hiring criterion rather than a subjective preference.
The most sophisticated TA teams are building ramp-time predictions into their hiring models. By correlating pre-hire signals—assessment scores, interview ratings, candidate engagement scores, and source quality—with post-hire ramp data, they can estimate how quickly a candidate is likely to reach full productivity before extending an offer. This kind of predictive capability transforms the hiring conversation with business leaders. Instead of saying "We found a strong candidate," you can say "Based on our data, this candidate is projected to reach full productivity within eight weeks, which is 25 percent faster than our average." That is the kind of insight that earns recruiting a seat at the strategic planning table.
Hiring Manager Satisfaction and Its Ripple Effect
Hiring manager satisfaction is one of those metrics that gets surveyed but rarely acted upon. Most organizations collect a quick satisfaction rating after a hire is made—usually a five-point scale asking whether the manager is happy with the candidate presented. The score gets logged, maybe reviewed quarterly, and then promptly ignored. This is a missed opportunity of significant proportions. Hiring manager satisfaction is not just a feel-good metric. It is a leading indicator of team performance, new hire retention, and the likelihood that the hiring manager will engage with the recruiting process again in the future. A hiring manager who rates their experience as a 2 out of 5 is not just disappointed—they are statistically more likely to bypass the recruiting process next time, rely on personal networks, and make ad-hoc hires that bypass the evaluation standards the TA team has worked to establish.
The ripple effect of hiring manager dissatisfaction extends far beyond a single search. LinkedIn data shows that hiring managers who rate their recruiting partnership below 3 out of 5 are 60 percent more likely to rely on informal channels for future hires, which means the TA team loses visibility and influence over a growing portion of the company's talent intake. This creates a vicious cycle: the recruiting team's data gets weaker because fewer hires flow through the tracked process, which makes it harder to demonstrate value, which leads to further disengagement from hiring managers. The hidden metric to track is not just the overall satisfaction score, but the correlation between hiring manager satisfaction and downstream outcomes like new hire performance, retention, and time to productivity.
Improving hiring manager satisfaction requires more than faster response times and more candidates. It requires genuine partnership—understanding the business context of the role, co-creating evaluation criteria, providing market intelligence on compensation and talent availability, and being transparent about pipeline challenges. TA teams that treat hiring managers as strategic partners rather than internal customers see satisfaction scores that are consistently 20 to 30 points higher, and the hiring outcomes from those partnerships reflect that alignment. The distinction between AI sourcing and full-cycle AI recruiting becomes relevant here, as hiring managers who understand the capabilities and limitations of the tools being used are more realistic in their expectations and more satisfied with the results.
First-Year Retention Rate: The Ultimate Quality Check
First-year retention rate is the single most definitive metric for evaluating whether a hire was successful. Every other metric—engagement score, interview ratings, sourcing channel quality—is a prediction. First-year retention is the outcome. It answers with binary clarity whether the hiring process identified the right person and whether the onboarding experience set them up for success. Despite its importance, many TA teams do not own this metric. It lives in HR operations or people analytics, disconnected from the recruiting data that influenced the hiring decision. This separation makes it nearly impossible for recruiting teams to learn from their outcomes and improve their process over time.
The financial impact of first-year turnover is staggering. When you account for recruiting costs, onboarding investment, manager time, lost productivity during the vacancy, and the productivity gap while the replacement gets up to speed, a single early departure can cost one and a half to two times the employee's annual compensation. For a company making 200 hires a year with a 20 percent first-year turnover rate, that is 40 failed hires—and a cost that runs into tens of millions of dollars. McKinsey estimates that companies with structured hiring processes and predictive metrics reduce first-year turnover by up to 25 percent, translating directly to bottom-line savings that far exceed the cost of implementing better measurement systems.
The most actionable approach is to break first-year retention down by the variables that recruiting can actually influence: hiring source, interview panel composition, assessment type and score, time from first contact to offer, and compensation relative to market. When you can show that hires from a specific sourcing channel have a 90 percent first-year retention rate while another channel produces only 65 percent, you have a clear mandate to reallocate budget. When you can demonstrate that candidates who go through a structured interview process retain at 85 percent compared to 70 percent for unstructured interviews, you have evidence that justifies investing in interviewer training and process standardization. This is the kind of data that turns recruiting from a gut-driven function into an evidence-based discipline.
How to Build a Predictive Hiring Metrics Framework
Building a predictive hiring metrics framework does not require a multimillion-dollar analytics investment. It requires a disciplined approach to connecting pre-hire signals with post-hire outcomes. The first step is identifying the outcome you want to predict—in most cases, that is first-year performance and retention. The second step is cataloging every data point you collect during the hiring process: source of hire, candidate engagement score, assessment results, interview ratings, time-to-hire, compensation, and hiring manager satisfaction. The third step is correlating these pre-hire data points with your post-hire outcome data to identify which signals have the strongest predictive relationship with success.
Gartner recommends starting with a minimum viable metrics set of six to eight indicators, testing their predictive power over two to three hiring cycles, and then refining based on what the data reveals. The biggest mistake TA teams make is trying to measure everything at once, which leads to data overload without actionable insight. Instead, focus on the metrics that show the strongest correlation with your specific outcomes. For some organizations, candidate engagement score might be the strongest predictor. For others, it might be source quality or ramp time. The framework should be tailored to your business context, not borrowed from a template.
The final and most critical step is closing the feedback loop. Every quarter, the TA team should review hiring outcome data—performance ratings, retention, ramp time—and trace those outcomes back to the pre-hire signals that predicted them. This retrospective analysis is what transforms a static dashboard into a dynamic learning system. Over time, the team builds an institutional knowledge base that continuously improves hiring accuracy. When this framework is operating effectively, recruiting ceases to be a reactive function that responds to requisitions and becomes a proactive strategic capability that consistently delivers high-performing talent to the organization. That is the standard every TA team should be building toward—and these hidden metrics are the foundation to get there.