Sofia Bergstrom had been head of talent operations at a five-hundred-person fintech for eight months when she presented her first quarterly operations review to the executive team. The slide deck had forty-two KPIs, organized by category, with trend lines and benchmarks. The CFO interrupted her on slide eleven. Sofia, he said, I can see that you have measured everything that can be measured. What I cannot see is what any of these numbers should make me decide to do. Sofia paused, because the question was the question she had been afraid of. She had built the deck to demonstrate that the operations function was measuring everything, and the measurement was what she had been hired to build. But the CFO's question had exposed the gap between measurement and decision, and the gap was what separated a dashboard from a decision tool, and the dashboard without the decision was the artifact that the executive team could not act on and that the executive team's inability to act was what the operations function was supposed to prevent. Sofia spent the next quarter rebuilding the KPI framework around the decisions each KPI should drive, and the rebuilt framework had twenty-three KPIs instead of forty-two, and each KPI was paired with the decision it should drive and the threshold that should trigger the decision. The next quarterly review took thirty minutes, and the executive team made four decisions in the meeting. Here is the framework Sofia used, and how any operations leader can build the same.
What Recruitment Operations KPIs Actually Are
Recruitment operations KPIs are the metrics that measure the health and performance of the recruiting process as a system, not just the outcomes that the system produces, and the distinction matters because the outcomes are the lagging indicators that tell you what happened while the operations are the leading indicators that tell you what is going to happen, and the leading indicators are what enable the team to act before the lagging indicators deteriorate. The time-to-fill is an outcome KPI that tells you how long a requisition took to fill. The phase-level cycle time is an operations KPI that tells you which phase produced the delay, and the phase-level cycle time is what enables the team to address the delay before the next requisition's time-to-fill deteriorates as a result of the same phase. The outcome KPI without the operations KPI is the metric that reports the problem without revealing the cause, and the operations KPI without the outcome KPI is the metric that reports the cause without connecting it to the outcome that the cause produces, and the two are what together produce the decision that the team can act on.
The reason operations KPIs matter more in 2026 than ever before is that the complexity of the recruiting process has grown faster than the metrics that measure it, and the complexity without the metrics is what produces the function that operates blind, and the blind function is the function that cannot improve because the improvement requires the measurement that the blind function does not have. According to McKinsey research on talent operations, the companies that have built operations KPI frameworks report forty percent faster improvement cycles and thirty-five percent better hiring outcomes, because the operations KPIs are what produce the visibility that the improvement requires, and the visibility is what produces the decisions that the improvement depends on, and the decisions are what produce the improvement that the visibility enables. As our analysis of more tools same hiring problems argues, the teams that have invested in tools without investing in operations KPIs have invested in the capacity that the system cannot measure, and the unmeasured capacity is what produces the tool spend that does not produce the hires that the spend was intended to produce.
The discipline of operations KPIs is the discipline of measuring what you can act on rather than measuring what you can only report, because the metric that you can only report is the metric that produces the dashboard that no one acts on, while the metric that you can act on is the metric that produces the decision that improves the process. The discipline is what separates the operations function that produces value from the operations function that produces reports, and the separation is what determines whether the operations function is a strategic investment or a cost center, and the determination is what the executive team is making when it decides whether to invest in the operations function or to cut it, and the decision is what the operations KPI framework is what enables the operations function to influence in the direction that the function requires the decision to go.
The Seven KPI Categories Every Operations Function Needs
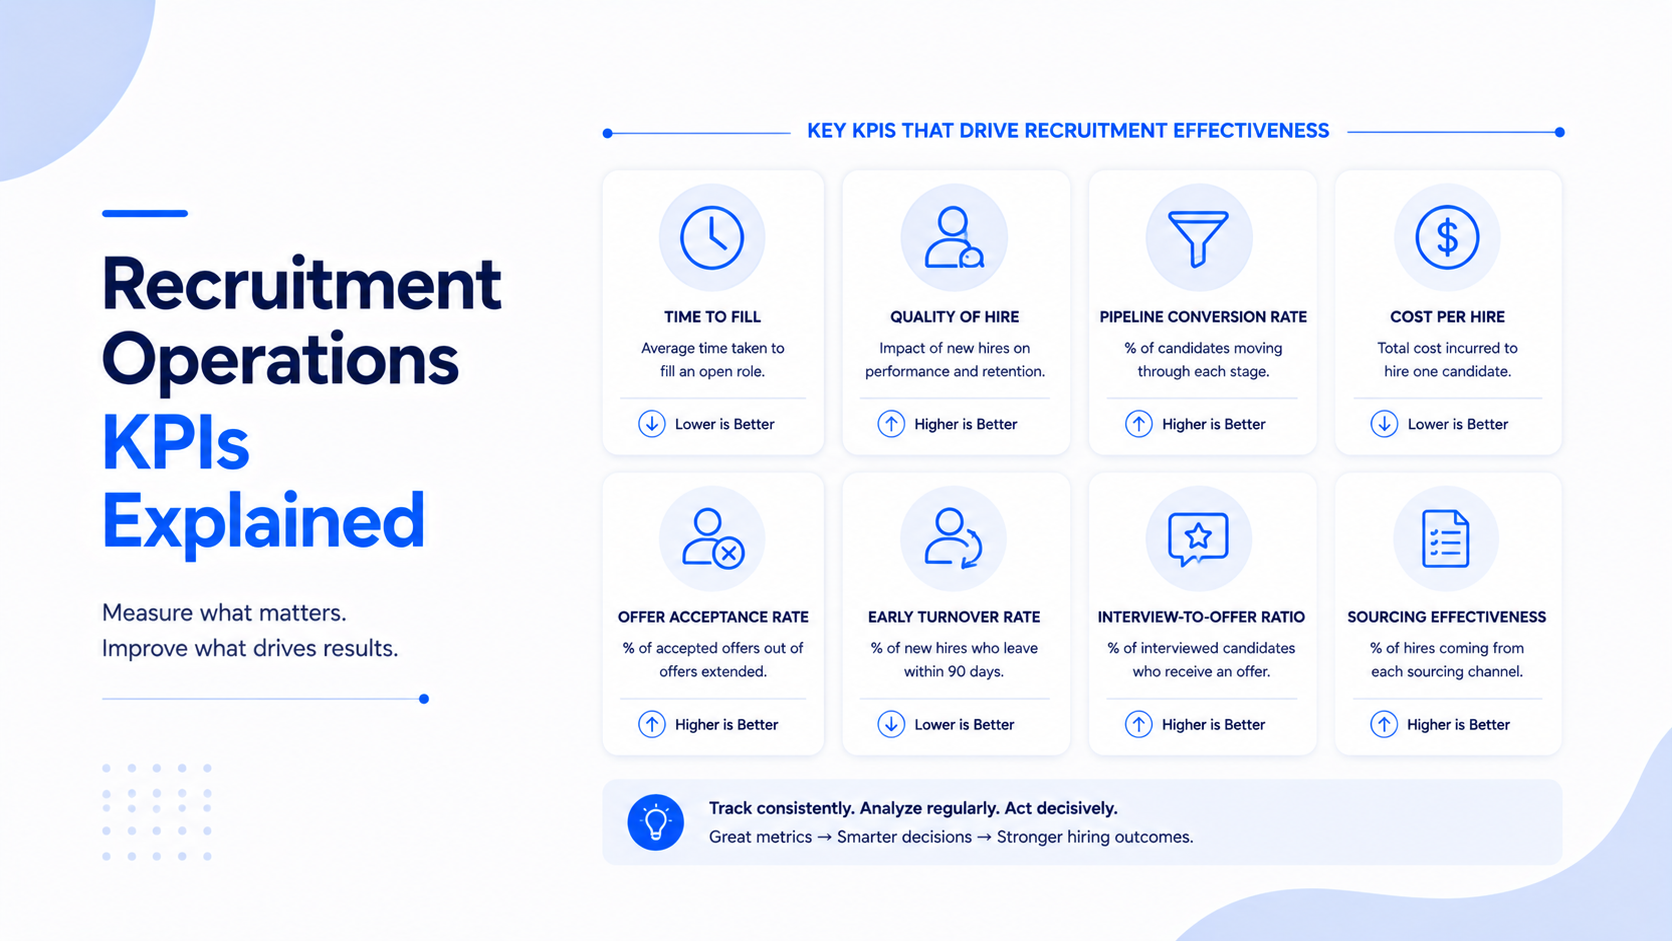
The seven KPI categories that every operations function needs are process KPIs, capacity KPIs, quality KPIs, cost KPIs, experience KPIs, equity KPIs, and adoption KPIs, and each category measures a different dimension of the operations function's performance, and the seven categories together produce the complete picture that the operations function requires to manage the process as a system. The process KPIs measure the cycle time and the conversion rate at each phase of the hiring process, because the process is the system that produces the hires and the process's performance is what determines whether the hires are produced efficiently. The capacity KPIs measure the volume that each phase can handle, because the capacity is what determines whether the process can scale and whether the bottlenecks are forming. The quality KPIs measure the performance and retention of the hires the process produces, because the quality is what determines whether the process is producing the hires that the company needs.
The cost KPIs measure the resources the process consumes, because the cost is what determines whether the process is producing the hires efficiently, and the efficiency is what the executive team is measuring when it evaluates the operations function's return on investment. According to Gartner talent acquisition research, the operations functions that measure all seven KPI categories report fifty percent better decision quality, because the seven categories together produce the complete picture that the decision requires, and the complete picture is what produces the decision that the partial picture does not produce and that the operations function was designed to enable the executive team to make. The seven categories are not optional—the operations function that measures some and not others is the function that has a partial picture, and the partial picture is what produces the decision that is wrong in the dimensions that the partial picture does not measure.
The experience KPIs measure the candidate and hiring manager experience of the process, because the experience is what determines whether the process produces the candidates who accept the offers and the hiring managers who recommend the process to their peers. The equity KPIs measure the outcomes of the process across demographic groups, because the equity is what determines whether the process is fair and whether the fairness is what the company's values require the process to be. The adoption KPIs measure whether the team is actually using the process and the tools that the operations function has designed, because the adoption is what determines whether the process and the tools are producing the value they were designed to produce, and the non-adoption is what produces the operations function that designs the process and the tools that the team does not use and that the non-use is what produces the operations function that does not produce the value it was designed to produce.
Process KPIs: The Phase-by-Phase View That Reveals the Bottleneck
The process KPIs are the KPIs that measure the cycle time and the conversion rate at each phase of the hiring process, and they are the most important KPIs because they are what reveal the bottleneck that is limiting the throughput of the entire process, and the bottleneck is what the operations function exists to identify and eliminate. The process KPIs should be measured at each of the seven phases—requisition intake, sourcing, screening, interview, decision, offer, onboarding—and each phase should have a cycle time KPI and a conversion rate KPI, because the cycle time is what reveals the slow phase and the conversion rate is what reveals the leaky phase, and the slow phase and the leaky phase are the two types of bottleneck that the operations function must identify and eliminate.
The first process KPI is the phase-level cycle time, which is the time that candidates spend in each phase, including the work time and the queue time, because the queue time is what reveals the bottleneck and the work time is what reveals the slow phase, and the distinction matters because the bottleneck is the phase with the longest queue time rather than the phase with the longest work time. According to SHRM research on recruiting metrics, the teams that measure phase-level cycle time report thirty-five percent faster cycle time improvements, because the phase-level measurement is what reveals the phase that the improvement should target, and the targeting is what produces the improvement that the aggregate measurement does not produce, because the aggregate measurement hides the phase that the improvement should target and that the hiding is what produces the improvement that does not target the phase that the improvement should target.
The second process KPI is the phase-level conversion rate, which is the percentage of candidates who advance from one phase to the next, because the conversion rate is what reveals the phase that is losing candidates and the phase that is losing candidates is the phase that the operations function should examine for the defect that is producing the loss. As our analysis of the recruiting dashboard every TA team needs explains, the dashboards that produce the most useful process KPIs are those that display the cycle time and the conversion rate side by side, because the side-by-side display is what reveals the relationship between the two and that the relationship is what reveals the bottleneck that the cycle time alone or the conversion rate alone does not reveal and that the operations function was designed to identify and eliminate.
Capacity and Cost KPIs: What Your Process Can Handle and What It Costs
The capacity and cost KPIs are the KPIs that measure what the process can handle and what it costs to handle it, and they are the KPIs that the executive team uses to evaluate whether the operations function is producing the return on investment that the function was funded to produce. The capacity KPIs measure the volume that each phase can handle, and the cost KPIs measure the resources that each phase consumes, and the two together produce the efficiency measure that the executive team uses to evaluate the operations function and that the evaluation is what determines whether the function is funded or cut.
The first capacity KPI is the recruiter-to-requisition ratio, which is the number of requisitions that each recruiter is responsible for, because the ratio is what reveals whether the recruiter has the capacity to handle the requisitions effectively, and the ratio that is too high is the ratio that produces the recruiter who cannot evaluate the candidates carefully and that the carelessness is what produces the quality deterioration that the capacity KPI is what reveals before the quality deterioration manifests in the outcome KPI. According to LinkedIn talent research on recruiter capacity, the optimal recruiter-to-requisition ratio varies by role family but averages one to fifteen for professional roles, and the teams that exceed the ratio report twenty percent lower quality-of-hire, because the exceeded ratio is what produces the recruiter who cannot evaluate the candidates carefully and that the carelessness is what produces the quality deterioration that the ratio KPI is what reveals and that the operations function can address before the quality deterioration manifests in the outcome KPI.
The second capacity KPI is the tool utilization rate, which is the percentage of the team that is actually using each tool that the team has purchased, because the utilization is what reveals whether the tool is producing the value it was purchased to produce, and the low utilization is what reveals the tool that should be eliminated and that the elimination is what produces the cost saving that the utilization KPI enables. As our guide on how to evaluate an AI sourcing tool explains, the platforms that produce the most useful capacity KPIs are those that produce the utilization data as a byproduct of the process, because the byproduct data enables the operations function to monitor the utilization without the separate measurement that the team would otherwise have to do and that the team often does not do because the measurement is not part of the team's regular workflow. The cost KPIs include the cost per hire, the cost per qualified candidate, and the cost per offer accepted, and each of these cost KPIs is what reveals whether the process is producing the hires efficiently, and the efficiency is what the executive team is measuring when it evaluates the operations function's return on investment and that the evaluation is what determines whether the function is funded or cut.
Quality and Experience KPIs: The Outcomes That Operations Enables
The quality and experience KPIs are the KPIs that measure the outcomes that the operations function enables, and they are the KPIs that connect the operations function's work to the outcomes that the executive team cares about, and the connection is what justifies the operations function's existence and the investment it requires. The quality KPIs measure the performance and retention of the hires the process produces, because the quality is what determines whether the process is producing the hires that the company needs, and the hires that the company needs are what the process was designed to produce, and the quality is what reveals whether the design is working. The experience KPIs measure the candidate and hiring manager experience of the process, because the experience is what determines whether the process produces the candidates who accept the offers and the hiring managers who recommend the process to their peers, and the acceptance and the recommendation are what the experience is what produces and that the experience KPI is what reveals.
The first quality KPI is the ninety-day new hire performance score, which is the manager's assessment of the new hire's performance at the ninety-day mark, because the ninety-day mark is the point at which the new hire has been in the role long enough to be evaluated and the point at which the evaluation is what reveals whether the hire was a good hire or a bad hire, and the revelation is what the quality KPI is what produces and that the operations function is what enables the team to produce the good hires that the company needs and that the quality KPI is what reveals whether the operations function is producing them. According to Deloitte workforce analytics on quality of hire, the teams that measure the ninety-day performance score report twenty-five percent better quality-of-hire improvement, because the measurement is what produces the feedback loop that the improvement requires, and the feedback loop is what produces the improvement that the measurement enables.
The second quality KPI is the first-year retention rate, which is the percentage of hires who are still with the company at the one-year mark, because the first-year retention is what reveals whether the hires were the right hires, and the hires who leave within the first year are the hires who were probably the wrong hires, and the first-year retention is what reveals the wrong hires before the wrong hires become the expensive turnover that the first-year retention KPI is what enables the team to prevent. As our analysis of AI sourcing vs AI recruiting shows, the platforms that produce the most useful quality KPIs are those that connect the hiring data to the performance data, because the connection is what enables the team to examine which sourcing channels and screening practices produce the hires who perform and stay, and the examination is what enables the team to improve the process that produces the hires and that the improvement is what the quality KPI is what enables the team to produce. The experience KPIs include the candidate net promoter score and the hiring manager satisfaction score, and each of these is what reveals whether the process is producing the experience that produces the acceptance and the recommendation that the process was designed to produce.
Equity and Adoption KPIs: The Hidden Drivers of Long-Term Performance
The equity and adoption KPIs are the KPIs that most operations functions do not measure and that the absence of the measurement is what produces the function that performs well on the visible KPIs and that deteriorates on the invisible KPIs that the visible KPIs depend on. The equity KPIs measure the outcomes of the process across demographic groups, because the equity is what determines whether the process is fair, and the unfair process is the process that produces the outcomes that the company's values do not permit, and the equity KPI is what reveals the unfairness before the unfairness becomes the public relations crisis that the equity KPI is what enables the team to prevent. The adoption KPIs measure whether the team is actually using the process and the tools that the operations function has designed, because the non-adoption is what produces the operations function that designs the process and the tools that the team does not use, and the non-use is what produces the operations function that does not produce the value it was designed to produce.
The first equity KPI is the demographic composition of the candidate pipeline at each phase of the process, because the composition at each phase is what reveals the phase where the demographic imbalance is introduced, and the phase where the imbalance is introduced is the phase that the operations function should examine for the bias that is producing the imbalance, and the bias is what the equity KPI is what reveals and that the operations function is what enables the team to eliminate. According to EY research on equity in hiring, the teams that measure the demographic composition at each phase report thirty percent better demographic outcomes, because the measurement is what produces the visibility that the improvement requires, and the visibility is what produces the improvement that the measurement enables.
The second equity KPI is the offer acceptance rate by demographic group, because the acceptance rate by group is what reveals whether the offer process is producing the same outcomes for all groups, and the different outcomes for different groups are what reveal the bias that the offer process is producing and that the bias is what the operations function is what enables the team to eliminate. As our analysis of agentic AI platforms vs automated ones demonstrates, the platforms that produce the most useful equity KPIs are those that produce the demographic data as a byproduct of the process, because the byproduct data enables the team to monitor the equity without the separate data collection that the team would otherwise have to do. The adoption KPIs include the percentage of recruiters who use the structured interview guide and the percentage of hiring managers who use the calibrated scorecard, and each of these is what reveals whether the process and the tools that the operations function has designed are actually being used by the team that the process and the tools were designed for, and the use is what produces the value that the design was intended to produce and that the non-use is what prevents the design from producing the value that the team was trying to produce.
Pairing Each KPI with the Decision It Should Drive
The discipline that separates the operations KPI framework that produces decisions from the framework that produces reports is the pairing of each KPI with the decision it should drive, because the KPI without the decision is the metric that produces the dashboard that no one acts on, while the KPI with the decision is the metric that produces the action that the dashboard was designed to enable. The pairing is what turns the KPI from a report into a tool, and the tool is what produces the improvement that the report does not produce, and the improvement is what the operations function was designed to produce and that the pairing is what enables the function to produce it.
The first pairing discipline is to define the decision that each KPI should drive, because the decision is what the KPI is for, and the KPI without the decision is the KPI that does not produce the value it was designed to produce. The phase-level cycle time KPI should drive the decision to redesign the phase that has the longest cycle time, and the decision should be triggered when the cycle time exceeds the threshold that the operations function has defined. The phase-level conversion rate KPI should drive the decision to examine the phase that has the lowest conversion rate, and the decision should be triggered when the conversion rate falls below the threshold. According to McKinsey research on talent operations, the operations functions that pair each KPI with the decision it should drive report sixty percent better decision quality, because the pairing is what produces the decision that the KPI was designed to enable, and the decision is what produces the improvement that the KPI was designed to drive.
The second pairing discipline is to define the threshold that should trigger the decision, because the threshold is what produces the trigger that the decision requires, and the trigger is what produces the decision that the threshold enables, and the threshold is what turns the KPI from a metric that is monitored into a metric that is acted on. The threshold should be based on the benchmark that the operations function has established, and the benchmark should be based on the performance of the best teams in the company or the best teams in the industry, and the benchmark is what produces the threshold that the decision is what the threshold is what triggers. As our analysis of more tools same hiring problems demonstrates, the teams that have built the most effective KPI frameworks are those that have paired each KPI with the decision and the threshold, because the pairing is what produces the framework that the executive team can act on, and the action is what produces the improvement that the framework was designed to drive and that the framework is what enables the team to produce and that the executive team is what enables the team to produce it through the decisions that the framework is what enables the executive team to make.