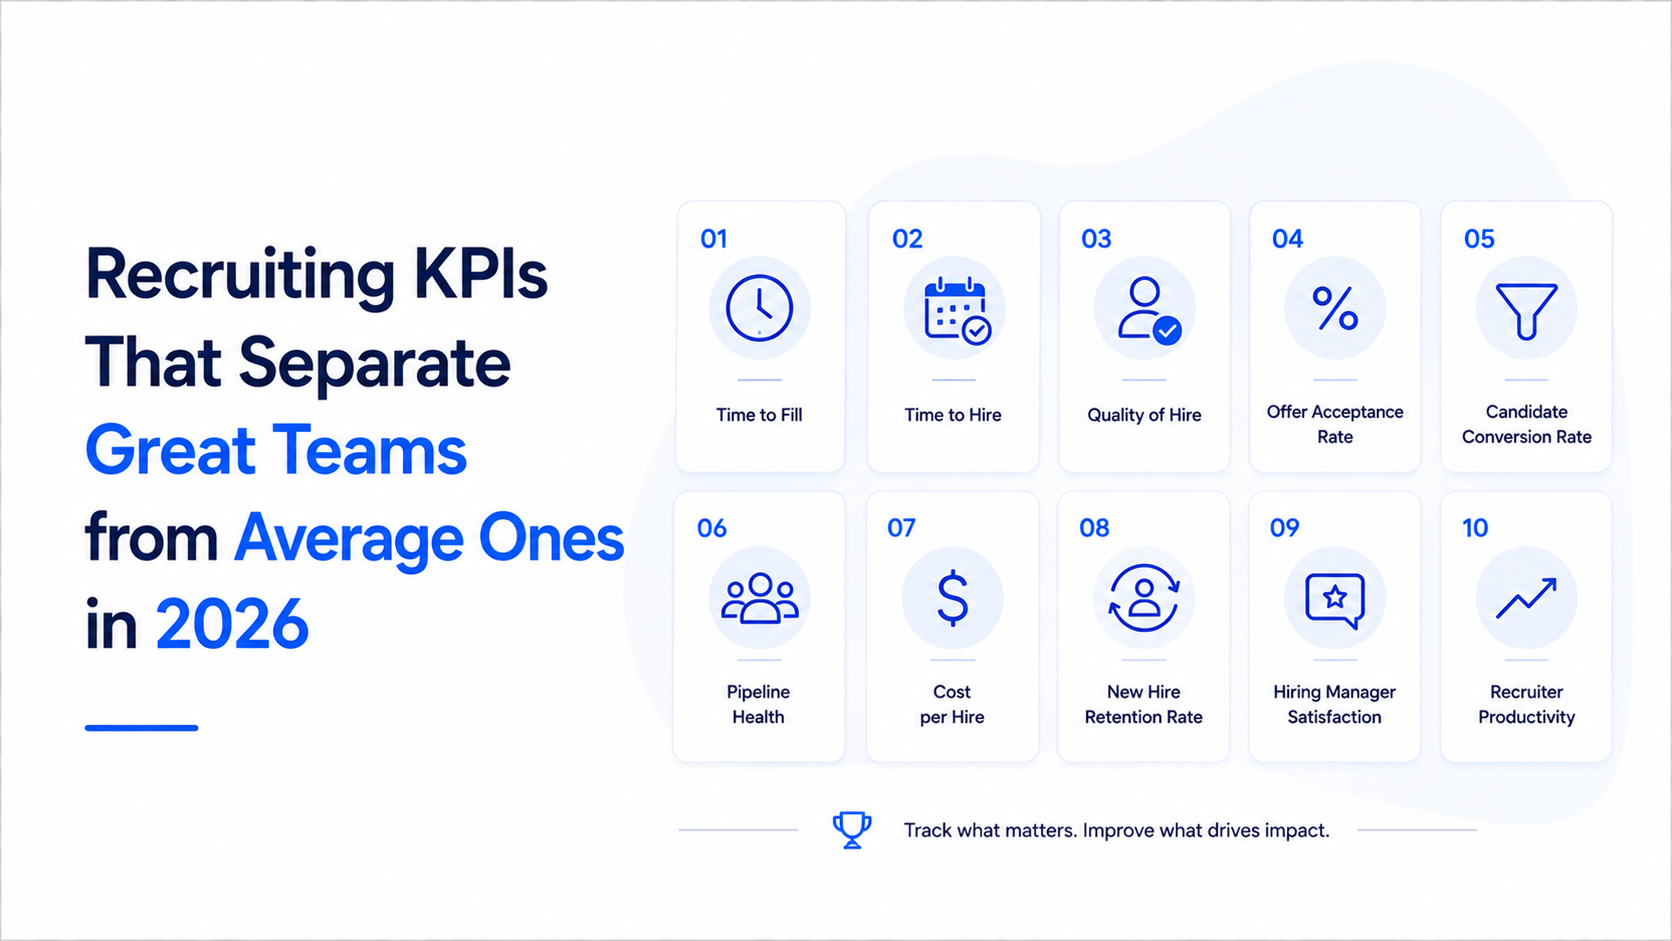
Open the dashboard of almost any talent acquisition team and you will see the same metrics staring back: time-to-fill, cost-per-hire, open requisitions, and maybe offer acceptance rate. These numbers are not wrong. They are just insufficient. They tell you whether the hiring engine is running, not whether it is running in the right direction. The difference between a great recruiting team and an average one is visible in the metrics they choose to prioritize. Average teams measure activity and efficiency. Great teams measure impact and quality. Average teams optimize for speed. Great teams optimize for outcomes. This distinction is not philosophical—it has measurable consequences for the quality of people who join the company, the revenue those people generate, and the strategic position the talent function occupies within the organization. The KPIs outlined in this post are drawn from the practices of TA teams that consistently outperform their peers. They are not exotic or difficult to implement. They simply require a deliberate choice to measure what matters rather than what is easiest to count.
Why Most Recruiting Teams Measure the Wrong Things
The recruiting KPIs that dominate most dashboards—time-to-fill, cost-per-hire, requisitions open, and applications received—became standard for a practical reason: they were the only data points available in early applicant tracking systems. These metrics were designed to measure the operational efficiency of a transactional hiring process, and they served that purpose adequately when recruiting was viewed as an administrative function. But the expectations placed on talent acquisition have shifted dramatically while the measurement systems have not. TA is now expected to be a strategic function that drives business performance, yet most teams are still being evaluated on metrics that have no correlation with business outcomes.
McKinsey research on high-performing organizations found that TA teams using outcome-aligned KPIs are 2.4 times more likely to be perceived as strategic partners by their business leaders compared to teams relying on operational metrics alone. The reason is straightforward: when you measure and report on quality of hire, revenue impact, and retention, you are speaking the language of the business. When you report on time-to-fill and requisition count, you are speaking the language of a back-office process. The metrics you choose to highlight determine how the organization perceives the value of your function, and most TA teams are inadvertently positioning themselves as operational rather than strategic by the KPIs they display most prominently.
The shift from operational to strategic KPIs does not mean abandoning time-to-fill or cost-per-hire. It means demoting them from primary indicators to secondary diagnostics. These metrics remain useful for identifying process bottlenecks and managing recruiting operations. They should simply not be the headline numbers on your dashboard or the primary metrics in your executive report. Great TA teams still track operational metrics internally. They just do not lead with them. Gartner advises that the transition should happen in stages: first, add one or two outcome metrics alongside your existing operational ones. Then, as the data matures and the organization adjusts, gradually increase the weight of outcome metrics in your reporting. Attempting to overhaul your entire KPI framework overnight creates confusion and resistance, while a phased approach builds momentum and credibility.
Quality of Hire: The KPI That Changes Everything
Quality of hire is the single most important differentiator between great and average recruiting teams. It is also the metric that average teams are least likely to measure. The reason is practical: quality of hire requires combining data from the recruiting process with post-hire performance data that lives in other systems. This cross-functional data integration is technically challenging, and many TA teams either lack the tools to do it or lack the organizational relationships to access the data they need. But the teams that solve this challenge unlock a KPI that fundamentally changes how recruiting is perceived and managed within the organization.
A well-constructed quality-of-hire metric typically combines first-year performance ratings, manager satisfaction scores, ramp-up time, and 12-month retention into a single composite score. LinkedIn global talent reports consistently identify quality of hire as the number one priority for recruiting leaders, yet fewer than 30 percent of organizations report having a formal, data-driven quality-of-hire metric in place. The gap between aspiration and execution is almost entirely a data integration problem. Performance data sits in the HRIS or performance management system. Retention data is tracked by HR operations. Manager feedback is collected through surveys or informal channels. None of these data sources are native to the ATS, which means the TA team needs to build bridges to other systems and functions to construct the metric.
The teams that have done this work report transformative results. When quality of hire becomes a primary KPI, the entire recruiting conversation shifts. Hiring managers become more engaged because they see recruiting outcomes tied to team performance. Recruiters become more selective about the candidates they advance because they know those candidates will be evaluated on long-term performance, not just whether they got hired. And TA leaders gain the ability to prove the ROI of their function in terms that resonate with the C-suite. SHRM benchmarking data shows that organizations with a formal quality-of-hire metric have 18 percent higher hiring manager satisfaction scores and 12 percent lower first-year turnover than those without one. These are not marginal improvements. They represent a significant competitive advantage in talent acquisition that compounds over time as the organization builds a stronger workforce.
Source Quality and Channel ROI
Average recruiting teams measure source of hire by volume: how many candidates came from each channel. Great teams measure source quality: how well those candidates performed after they were hired. This distinction is one of the most consequential KPI choices a TA team can make because it directly determines where recruiting budget is allocated. When volume is the primary measure, budget flows to the channels that produce the most candidates—typically job boards and paid advertising. When quality is the primary measure, budget flows to the channels that produce the best hires—typically employee referrals, direct sourcing, and targeted outreach.
The data on source quality is striking. Referral hires consistently outperform non-referral hires on virtually every quality dimension: first-year performance ratings are 15 to 25 percent higher, first-year retention is 20 to 30 percent higher, and ramp time is 15 to 20 percent faster. Deloitte talent acquisition research attributes this advantage to the pre-hire information that referrals provide. A candidate who comes through a referral has a more accurate expectation of the role, the team, and the company culture before they ever start. This alignment translates to faster integration and better performance. Yet despite this well-documented advantage, most companies still allocate the majority of their sourcing budget to paid channels that generate higher volume but lower quality.
Building a source-quality KPI requires linking hiring source data from the ATS with post-hire performance and retention data. When you can show that AI sourcing tools produce hires with a quality-of-hire score 20 percent above job board hires, you have a data-driven basis for reallocating budget. When you can demonstrate that candidates sourced through agentic AI platforms retain at 85 percent compared to 65 percent for inbound applicants, the investment case for these tools becomes self-evident. Great TA teams do not just measure source quality—they use it as the primary driver of their sourcing strategy and budget allocation, ensuring that every dollar spent on talent acquisition is directed toward the channels that deliver the highest return.
Hiring Manager Satisfaction as a Leading Indicator
Hiring manager satisfaction is frequently collected but rarely treated as a strategic KPI. In most organizations, it appears as a checkbox on a post-hire survey and disappears into a quarterly report that nobody acts on. Great TA teams treat it differently. They track hiring manager satisfaction at the individual recruiter level, segment it by role type and business unit, and use it as a leading indicator of both recruiting effectiveness and future hiring success. The reason it works as a leading indicator is intuitive: hiring managers who are satisfied with the recruiting process are more likely to engage early, provide clear requirements, respond quickly to candidate profiles, and partner effectively throughout the search. This partnership directly translates to better hiring outcomes.
EY talent management research has found a strong correlation between hiring manager satisfaction scores and quality-of-hire outcomes. Teams with average hiring manager satisfaction above 4.2 out of 5.0 produce hires with 20 percent higher first-year performance ratings compared to teams with satisfaction scores below 3.5. The mechanism is straightforward: satisfied hiring managers invest more in the recruiting process, which leads to better candidate evaluation, faster decision-making, and a more compelling candidate experience. Dissatisfied hiring managers, by contrast, disengage from the process, provide vague requirements, delay feedback, and create the kind of friction that causes strong candidates to withdraw.
The most effective approach to improving hiring manager satisfaction is to make it a shared KPI between the TA team and the hiring managers themselves. When satisfaction is presented as a partnership metric rather than a service rating, hiring managers become more invested in making the process work. Great TA teams share satisfaction data with business unit leaders, identify the hiring managers with the lowest scores, and work with them to improve the process. This collaborative approach transforms satisfaction from a passive survey metric into an active management tool. It also reveals a common pattern: the teams that struggle most with hiring manager satisfaction are often the ones that have added more tools without solving underlying process and communication issues, creating a more complex but not necessarily better experience for the hiring managers they serve.
Pipeline Health and Candidate Quality Ratio
Pipeline health is a KPI that captures the quality and depth of a recruiter's candidate pipeline, not just its size. Average teams measure pipeline volume—the number of candidates at each stage. Great teams measure the candidate quality ratio—the percentage of candidates in the pipeline who meet the defined qualification criteria for the role. A pipeline of 50 candidates sounds impressive until you realize that only 8 of them actually meet the job requirements. A pipeline of 20 candidates where 15 are qualified is far more valuable because it concentrates the recruiter's time and effort on candidates who can actually be hired.
McKinsey hiring analytics research shows that top-performing TA teams maintain a candidate quality ratio of 60 to 75 percent across their pipelines, compared to 35 to 45 percent for average teams. This difference is not because great teams attract better candidates—though they often do. It is because they are more disciplined about screening early and maintaining a pipeline of candidates who are genuinely qualified for the roles they are pursuing. A high quality ratio means the recruiter is spending their time on high-value activities—assessing strong candidates, building relationships, and managing the offer process—rather than sifting through unqualified applicants.
The pipeline health KPI should be tracked at both the individual recruiter level and the aggregate team level. At the recruiter level, it provides a coaching signal: a recruiter whose quality ratio has dropped below 50 percent likely needs to adjust their sourcing criteria or improve their initial screening process. At the team level, it provides a leading indicator of future hiring outcomes. A team-wide decline in candidate quality ratio will eventually manifest as lower quality-of-hire scores, longer time-to-fill, and higher offer-stage decline rates. Catching the decline early gives the TA leader time to intervene—whether by adjusting sourcing strategy, recalibrating job requirements, or investing in better AI recruiting tools that improve the quality of candidates entering the pipeline.
Diversity of Hire and Inclusive Pipeline Metrics
Great recruiting teams measure diversity of hire not as a compliance checkbox but as a core quality KPI that reflects the breadth and strength of their talent pool. Research consistently demonstrates that diverse teams perform better on virtually every business metric, from innovation output to revenue growth to employee engagement. Despite this evidence, diversity of hire remains one of the most inconsistently measured recruiting KPIs, tracked by some teams as an afterthought and ignored entirely by others. The teams that treat it as a primary KPI are not doing so out of obligation—they are doing so because they recognize that a hiring process that consistently produces homogeneous teams is a hiring process that is systematically excluding qualified talent.
Gartner talent acquisition research recommends tracking diversity at two levels: the pipeline level and the hire level. Pipeline diversity measures the demographic composition of candidates at each stage of the funnel. Hire diversity measures the demographic composition of candidates who actually receive and accept offers. The gap between pipeline diversity and hire diversity is where bias typically enters the process. If your pipeline is 40 percent diverse but your hires are only 20 percent diverse, something in your evaluation or selection process is filtering out diverse candidates at a disproportionate rate. This diagnostic insight is actionable—it points directly to the stage where intervention is needed, whether that is interview panel composition, assessment design, or offer-stage evaluation criteria.
The most effective diversity KPIs go beyond simple demographic counts. They measure inclusive pipeline health by tracking the conversion rates of diverse candidates at each funnel stage and comparing them to the conversion rates of non-diverse candidates. If diverse candidates convert from application to screening at the same rate as non-diverse candidates but drop off sharply at the interview-to-offer stage, the problem is not in your sourcing or screening—it is in your interview and evaluation process. This stage-level conversion analysis is what allows TA teams to move beyond aspirational diversity statements and toward measurable, systemic improvement. LinkedIn hiring data shows that companies that track and report on diversity conversion rates at every pipeline stage improve their diversity of hire by 15 to 25 percent within two years, compared to companies that only track the final hire demographic.
Time to Productivity and Long-Term Value
Average recruiting teams consider their job done when the candidate signs the offer. Great teams measure what happens after the hire starts—specifically, how quickly the new hire becomes productive and how much long-term value they create. Time to productivity is the number of days or weeks it takes for a new hire to reach full performance in their role. It is a recruiting KPI because the factors that influence it—quality of the hiring decision, accuracy of the job preview provided during interviews, cultural alignment between the candidate and the team—are all determined during the recruiting process. A hire who reaches full productivity in six weeks was better matched to the role than one who takes four months.
Deloitte workforce analytics highlights that time to productivity varies dramatically by the quality of the hiring process. Companies with structured interview processes, realistic job previews, and thorough candidate assessment report average time-to-productivity of 8 to 10 weeks for knowledge-worker roles. Companies with unstructured processes and limited candidate assessment report averages of 14 to 20 weeks. The difference represents months of partial productivity and manager time spent on additional coaching and support. When this metric is linked back to individual recruiters, it creates a powerful accountability signal: the recruiter whose hires ramp quickly is delivering more value per hire than the one whose hires take months to get up to speed.
Long-term value extends the measurement window even further. Some forward-thinking TA teams are now tracking the three-year business impact of their hires—revenue generated, projects delivered, teams built, and promotions earned—and linking that data back to the recruiting process and the individual recruiter who managed the search. This is the ultimate outcome KPI because it measures the full return on the recruiting investment over a meaningful time horizon. SHRM strategic workforce planning research indicates that companies measuring long-term hire value are better able to justify recruiting investments, allocate resources to the most effective recruiters, and make the case for TA as a strategic function that drives business performance rather than a cost center that fills requisitions. The teams that adopt this long-term view are the ones that will define what great recruiting looks like in the decade ahead.
Building Your KPI Framework: Where to Start
Transitioning from an operational KPI set to an outcome-aligned one does not require a complete overhaul. The most successful approach is to start by adding two or three strategic KPIs to your existing dashboard while keeping your operational metrics as secondary diagnostics. The three KPIs that provide the most immediate impact are quality of hire, source quality, and hiring manager satisfaction. These three metrics alone—if measured consistently and reported visibly—will shift the behavior and perception of your TA team more than any process change or tool investment. Quality of hire connects recruiting to business outcomes. Source quality optimizes budget allocation. Hiring manager satisfaction strengthens the partnership between TA and the business.
McKinsey organizational design research emphasizes that KPI changes should be introduced with clear communication about why the new metrics matter and how they will be used. If recruiters perceive the new KPIs as a tool for punishment rather than development, they will resist. If they understand that the goal is to measure and reward the work that creates the most value—rather than just the work that produces the highest volume—they will engage. The most effective TA leaders frame the KPI transition as an investment in the team's ability to demonstrate its strategic value, not as a surveillance mechanism. This framing is particularly important when introducing AI-powered tools, because evaluating whether these tools are genuinely improving hiring outcomes requires the kind of outcome data that strategic KPIs provide.
The final step is establishing a regular KPI review cadence. Monthly team-level reviews and quarterly executive reports create the rhythm that turns metrics into action. Each review should follow a simple structure: here is where we stand on each KPI, here is how it has changed over the past period, here is what we believe is driving the change, and here is what we plan to do about it. This cycle of measurement, diagnosis, and action is what separates teams that use KPIs as a management discipline from teams that collect data but never act on it. The KPIs themselves are important, but the discipline of reviewing them consistently and making decisions based on what they reveal is what ultimately separates great recruiting teams from average ones.