hink of your recruiting funnel the way an engineer thinks about a water pipeline. At every joint, every bend, every valve, there is potential for leakage. Some loss is expected and acceptable. But when the loss at any single stage exceeds what engineering standards allow, the entire system becomes inefficient—you are pumping more water in at the top just to get a trickle out at the bottom. Recruiting funnels work the same way. Candidates enter at the top through career sites, job boards, referrals, and outreach. At each subsequent stage—application, screening, interview, offer—a portion of them drops out. The question is not whether you are losing candidates. You are. The question is whether your loss rates at each stage are within a healthy range or whether they signal a problem that is costing you time, money, and the best talent. This post provides the benchmarks that help you answer that question with data rather than guesswork.
What Recruiting Funnel Benchmarks Actually Tell You
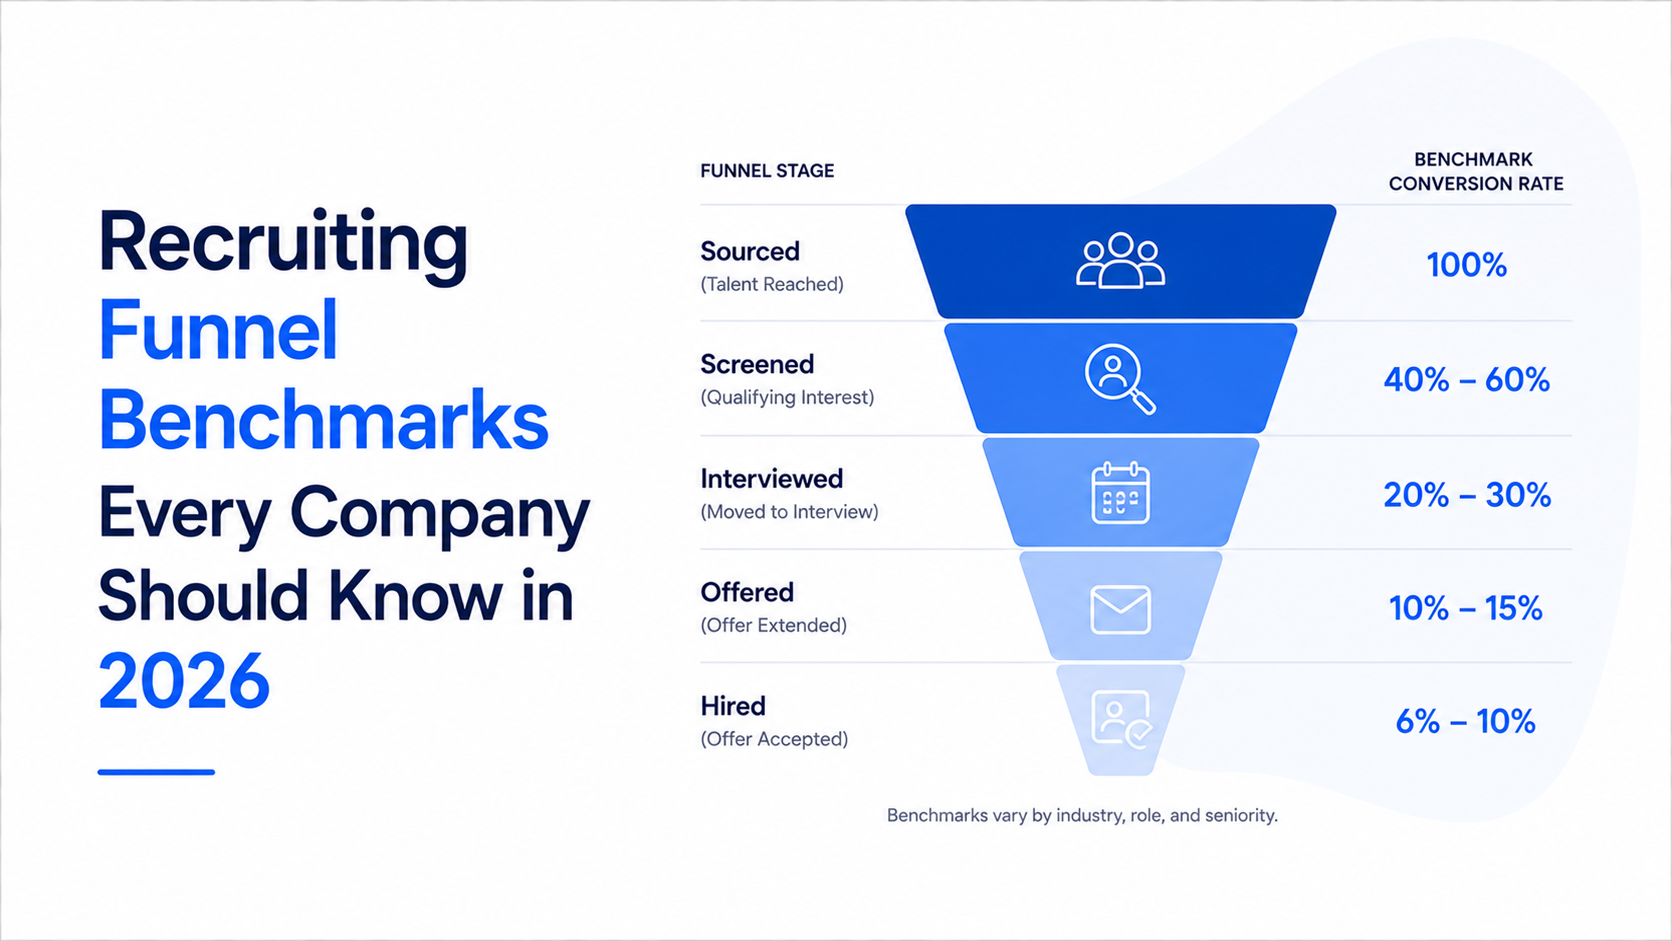
Recruiting funnel benchmarks are not aspirational targets. They are diagnostic tools. They exist to give you a reference point against which you can compare your own performance and identify whether the challenges you are experiencing are normal for your industry and role type or whether they indicate a process problem that needs fixing. A company hiring software engineers in San Francisco will have a very different funnel profile than a company hiring warehouse associates in Dallas, and comparing their raw conversion numbers without context would be meaningless. Benchmarks provide that context by segmenting data by industry, role type, company size, and geography so you can compare yourself against a relevant peer group rather than an abstract average.
McKinsey talent acquisition research emphasizes that the most valuable use of benchmarking data is not the comparison itself but the diagnostic conversation it triggers. When a TA leader can show their hiring managers that their screening-to-interview conversion rate is 15 percent below the industry benchmark for similar roles, the conversation shifts from "the market is tough" to "let us understand what is driving the gap." This kind of evidence-based dialogue is far more productive than the subjective back-and-forth that characterizes most hiring pipeline discussions. Benchmarks turn opinions into data points, and data points into action plans.
The most common mistake companies make with benchmarking is treating a single number as the truth. Gartner advises that effective benchmarking requires looking at ranges rather than medians, because the spread in recruiting funnel data is enormous. An "average" application completion rate of 55 percent might represent a range from 30 percent to 80 percent across companies, and knowing where you sit within that range is far more informative than knowing the midpoint. The benchmarks in this post are presented as ranges for exactly this reason. Your goal is not to hit the median. Your goal is to understand whether you are within a healthy range and, if not, where to focus your improvement efforts.
Application-to-Screening Conversion: Where the Biggest Leak Happens
The application-to-screening stage is where the recruiting funnel loses the largest absolute number of candidates, and the benchmarks here reveal a significant problem across the industry. For professional and knowledge-worker roles, the typical application completion rate—the percentage of candidates who begin an application and actually submit it—falls between 45 and 65 percent, according to multiple industry analyses compiled by LinkedIn. This means that for every 100 candidates who click "Apply," between 35 and 55 of them abandon the process before submitting anything. For mobile applicants, the completion rate drops even further, typically landing between 30 and 50 percent. These are not marginal leaks. They represent the single largest source of candidate loss in the entire funnel.
The screening stage—where submitted applications are reviewed and either advanced or rejected—introduces another significant filter. For most professional roles, the screening-to-advancement rate falls between 15 and 30 percent. This means that of the candidates who actually complete an application, only one in five to one in seven will be advanced to the next stage. SHRM talent acquisition data shows that this screening rate has been declining slightly over the past several years as application volumes have increased and recruiter-to-candidate ratios have remained flat. More applications per recruiter means less time per application, which means more qualified candidates are being screened out accidentally simply because the reviewer did not have time to evaluate them thoroughly.
The combined effect of these two stages is striking. If 55 percent of candidates complete the application and 20 percent of those are advanced through screening, the overall conversion from career site visitor to screened candidate is roughly 11 percent. For every 1,000 people who land on your job posting, only about 110 make it past the initial screening. This is why AI sourcing tools have become so critical—they allow TA teams to bypass the application funnel entirely by identifying and engaging qualified candidates directly, rather than relying on a passive application process that loses the majority of interested candidates before they are even evaluated. Understanding this baseline is essential because it quantifies exactly how much potential talent your current process is discarding.
Screening-to-Interview Benchmarks by Role Type
The screening-to-interview conversion rate varies more dramatically by role type than almost any other funnel metric, and understanding these differences is essential for setting realistic expectations and diagnosing problems. For technical and engineering roles, the typical screening-to-interview rate falls between 10 and 20 percent, reflecting the high volume of applications these roles attract and the rigorous technical screening criteria most companies apply. For sales and business development roles, the range is higher—typically 20 to 35 percent—because the screening criteria tend to focus more on experience and track record than on technical skills, and the pipeline is often supplemented by direct sourcing rather than relying solely on inbound applications. For executive and senior leadership roles, the rate can swing wildly from 5 to 40 percent depending on how narrowly the search is defined.
Deloitte workforce analytics highlights that the role-type variance in screening-to-interview conversion is one of the primary reasons TA leaders struggle to set consistent hiring targets across their organizations. A recruiting team that is simultaneously hiring engineers, sales reps, and finance managers cannot use a single screening-to-interview benchmark because the healthy ranges are too different. The practical implication is that funnel benchmarks need to be segmented by role family—and ideally by role level—to be actionable. A TA dashboard that shows a 25 percent screening-to-interview rate across all roles is hiding more than it reveals, because that aggregate number might represent 12 percent for engineers, 30 percent for sales, and 35 percent for finance.
The companies that manage this complexity most effectively build role-specific funnel models that account for the typical conversion patterns of each role type they hire for. These models serve two purposes: they provide realistic pipeline targets for recruiters filling those roles, and they create early warning systems when actual conversion rates deviate from the expected range. If the engineering screening-to-interview rate drops from its typical 15 percent to 8 percent over two months, that is a signal that something has changed—perhaps the job requirements have drifted, the sourcing channels have shifted, or the screening criteria have been tightened unintentionally. Catching this kind of deviation early, before it manifests as missed hiring targets, is one of the most valuable capabilities that benchmark-driven funnel analytics can provide. Understanding whether your AI sourcing and AI recruiting tools are delivering candidates in the right volume and quality for each role type is essential to maintaining healthy conversion rates at this stage.
Interview-to-Offer Ratios and What They Reveal
The interview-to-offer ratio is the funnel metric that gets the most attention from hiring managers, and for good reason. It represents the point in the process where the organization has invested the most time and resources per candidate, and it is the stage where subjective judgment has the greatest influence on outcomes. For professional roles across most industries, the interview-to-offer ratio typically falls between 3:1 and 6:1—meaning the team interviews three to six candidates for every offer extended. McKinsey hiring process research shows that companies using structured interview methodologies tend to cluster at the lower end of this range—3:1 to 4:1—because structured evaluations produce more consistent and confident hiring decisions, reducing the need to interview additional candidates as a safety net.
An interview-to-offer ratio above 6:1 for a professional role is generally a signal that something in the evaluation process is not working efficiently. Common causes include unclear job requirements that lead hiring managers to keep searching for a candidate who matches an unrealistic profile, lack of alignment among interviewers about what constitutes a strong candidate, or a sourcing process that is not generating candidates who meet the basic qualifications. SHRM survey data indicates that companies with interview-to-offer ratios above 8:1 report significantly lower hiring manager satisfaction scores, suggesting that extended interview processes frustrate the business leaders they are supposed to serve.
At the other extreme, an interview-to-offer ratio below 2:1 can be equally problematic. While it might seem efficient, it often indicates that the screening process upstream is too strict—potentially filtering out qualified candidates before they reach the interview stage—or that the interview process itself is not rigorous enough to differentiate between candidates. The healthiest funnel is not the one with the lowest ratio at every stage but the one where ratios are balanced and consistent across stages. When interview-to-offer ratios vary dramatically between similar roles or between teams hiring for the same type of position, it usually signals inconsistent hiring practices rather than differences in candidate quality. This inconsistency is a leading indicator of both quality-of-hire problems and candidate experience issues, as candidates who go through a five-round process for one team but a two-round process for another will perceive the company as disorganized.
Offer Acceptance Rate Benchmarks Across Industries
Offer acceptance rate is the final conversion metric in the funnel, and its benchmarks are heavily influenced by industry, role seniority, and the competitiveness of the local talent market. Across all industries and role types, the typical offer acceptance rate falls between 70 and 85 percent. This means that most companies lose 15 to 30 percent of their offers at the final stage—a painful outcome given the investment required to reach this point. LinkedIn hiring trends data shows that technology companies typically experience lower acceptance rates—65 to 80 percent—due to intense competition for technical talent and the frequency with which candidates hold multiple competing offers. Healthcare and government sectors tend to see higher acceptance rates—80 to 92 percent—because the talent market is less competitive and candidates value the stability these employers offer.
Seniority level has an even stronger influence on acceptance rates than industry. Executive-level offers typically see acceptance rates between 50 and 70 percent, reflecting the specialized nature of these searches, the longer decision timelines involved, and the higher likelihood that executive candidates are being courted by multiple organizations simultaneously. Mid-level professional roles see the most consistent acceptance rates, generally falling between 75 and 85 percent. Entry-level and early-career roles can be highly variable, with acceptance rates ranging from 60 to 90 percent depending on the employer's brand recognition among early-career talent and the competitiveness of the offer package. EY talent surveys emphasize that offer acceptance rate for technology companies has been on a slow decline over the past three years as remote work has expanded the geographic scope of competition for technical roles.
The most actionable insight from offer acceptance benchmarks is not the overall number but the segmentation. When you break down acceptance rates by sourcing channel, a clear pattern typically emerges. Referred candidates accept at 85 to 95 percent. Candidates sourced through direct outreach by recruiters accept at 75 to 85 percent. Candidates who applied through job boards or career sites accept at 60 to 75 percent. This distribution reveals that the way a candidate enters your pipeline has a significant influence on their likelihood of accepting an offer, independent of compensation or role fit. Referred candidates have a pre-existing relationship with the company through their referrer, which provides information and trust that reduces uncertainty at the offer stage. This is why the most sophisticated TA teams are using agentic AI platforms to simulate some of that trust-building at scale—providing candidates with personalized information, timely follow-ups, and transparent communication throughout the process that mimics the referral experience for sourced and applied candidates alike.
How Company Size and Geography Affect Funnel Metrics
Company size has a measurable and consistent impact on funnel benchmarks, primarily because larger organizations have more brand recognition, larger recruiting budgets, and more complex hiring processes. Enterprise companies with more than 5,000 employees typically see application completion rates 10 to 15 percentage points higher than companies with fewer than 500 employees, largely because candidates are more willing to invest time in an application for a brand they recognize and trust. However, this advantage at the top of the funnel is partially offset at later stages. Large enterprises often have longer, more complex interview processes—which reduces interview-to-offer conversion rates—and more bureaucratic offer approval workflows—which extend the time between final interview and offer delivery, lowering acceptance rates.
Geography adds another layer of variation that is frequently overlooked. Hiring funnels in major metropolitan areas with dense talent pools—San Francisco, New York, London, Bangalore—operate very differently from funnels in smaller markets. Deloitte talent market analyses show that application volumes in tier-one cities are typically three to five times higher than in tier-two or tier-three markets, but the quality distribution of those applicants is also wider. More applications does not automatically mean more qualified candidates—it often means more unqualified candidates mixed in with a similar number of qualified ones. This dynamic means that screening-to-interview conversion rates in large markets are often lower than in smaller markets, even though the absolute number of qualified candidates is higher.
The practical takeaway is that your funnel benchmarks should be calibrated to your company size and primary hiring geographies. A 50-person startup in Austin should not be comparing its application-to-screening rate to a 10,000-person enterprise in New York and concluding that its recruiting process is broken. The context is completely different. Similarly, a company hiring primarily in smaller markets should expect different baseline conversion rates than a company hiring in the same roles but in major metropolitan areas. The best practice is to build an internal benchmark based on your own historical performance and then use external industry data as a secondary reference point for understanding whether your performance is reasonable relative to the market. However, many teams end up adding more tools without solving the underlying data problem that prevents them from building accurate internal benchmarks in the first place.
Using Benchmarks to Diagnose Your Pipeline Health
The real power of recruiting funnel benchmarks lies in their diagnostic utility. When you map your actual conversion rates against the benchmark ranges for your industry, role type, and company size, the result is a funnel health assessment that points directly to the stages that need attention. The diagnostic framework is straightforward. If your application completion rate is below the benchmark range, the problem is in your application experience. If your screening-to-interview rate is below range, the problem is in your screening criteria or sourcing quality. If your interview-to-offer ratio is above range, the problem is in your interview and evaluation process. If your offer acceptance rate is below range, the problem is in your offer process, compensation competitiveness, or candidate experience during the final stages.
Gartner recommends conducting this funnel health assessment quarterly, tracking not just the current snapshot but the trend over time. A screening-to-interview rate that has declined from 22 percent to 16 percent over two quarters is a more urgent signal than a rate that has been stable at 16 percent for a year, even though the absolute numbers are the same. Trends reveal whether your process is improving, deteriorating, or stable—and they help you evaluate whether recent changes to your process are having the intended effect. If you shortened your application form last quarter and the application completion rate improved by 8 percentage points, the benchmark data confirms that the change worked and provides a quantifiable return on the effort invested.
The most valuable output of a funnel health assessment is a prioritized action plan. Rather than trying to fix everything at once, you focus on the stage with the largest gap between your actual performance and the benchmark range. For most companies, that stage is application completion, where the gap between current performance and best-in-class represents the largest number of recoverable candidates. Fixing the application experience is often the highest-ROI recruiting investment a company can make because it requires no change to sourcing spend, no new job postings, and no additional recruiter headcount. It simply requires making it easier for candidates who are already interested to complete the process—a change that pays for itself in reduced sourcing costs and higher-quality candidate flow at every downstream stage.
Turning Benchmark Data into Recruiting Strategy
Benchmark data without action is just information. The final step—turning benchmarks into strategy—is where the most impact is realized. The approach that works best is to select one or two funnel stages where your performance is furthest below the benchmark range, set a specific improvement target, implement a targeted intervention, and measure the results over the next one to two hiring cycles. This disciplined, focused approach is far more effective than trying to overhaul the entire funnel simultaneously, which spreads resources thin and makes it impossible to attribute improvements to specific changes.
McKinsey case studies on recruiting transformation consistently show that the most successful TA leaders use benchmark data to build a narrative for their executive stakeholders. Rather than saying "our application completion rate is 40 percent," they say "our application completion rate is 40 percent, which is 15 points below the industry benchmark for our role types. Based on our current sourcing spend and application volumes, closing this gap would recover approximately 1,200 additional candidates per quarter without any increase in budget." This framing translates a process metric into a business outcome, which is the language that drives executive investment and organizational change.
The companies that consistently outperform on recruiting funnel metrics share three characteristics. First, they measure conversion at every stage, not just the aggregate. Second, they benchmark against relevant peer groups rather than relying on industry-wide averages. Third, they operate a continuous improvement cycle where benchmark data informs targeted interventions, and the results of those interventions are measured and fed back into the benchmarking process. This closed-loop approach ensures that the recruiting funnel is never treated as a fixed system but as a continuously improving one. Over time, companies that operate this way build a compounding advantage: their funnel becomes more efficient with every hiring cycle, which means they hire better people with less effort, which further improves their employer brand and candidate experience, which further improves their funnel metrics. That is the virtuous cycle that benchmarking is designed to initiate, and the companies that commit to it are the ones that will lead their talent markets in the years ahead.