Daniel Okafor had been Director of Talent Acquisition at a mid-market healthcare company for nine months when his COO asked a question he could not answer. Why does it take us forty-seven days to fill a software engineer when our competitor fills the same role in twenty-eight? Daniel had a dozen explanations—the market is harder here, our compensation is below median, our hiring managers are slow to schedule. Each explanation was true, and none of them was the answer. The answer was that no one at the company had ever mapped the hiring process end to end, so no one knew where the forty-seven days were being spent or where they were being lost. Daniel had inherited a process that had been assembled by three predecessors over five years, and each predecessor had added a step without ever documenting the whole. The result was a process that no one could see, and a process that no one can see is a process that no one can improve. The forty-seven days were hidden in the process like costs are hidden in a supply chain, and the only way to find them was to map the process from requisition to offer, phase by phase, handoff by handoff, hour by hour. Here is the playbook Daniel used, and the one that any TA leader can use to do the same.
What Process Mapping Means for Recruitment Teams
Process mapping is the practice of documenting a hiring workflow end to end, phase by phase, handoff by handoff, so that every step is visible, every owner is named, and every cycle-time contribution is measurable. It is not the same as having a process document, because most process documents describe the process as it was designed rather than the process as it is actually run, and the gap between the two is where most cycle time is lost. A process map is a living artifact that captures the real workflow as recruiters and hiring managers actually execute it, including the workarounds, the escalations, and the unofficial steps that the official process document pretends do not exist, because these unofficial steps are often where the cycle time is hiding and where the improvement opportunities are largest.
The reason process mapping matters more in 2026 than ever before is that hiring process complexity has grown faster than process documentation. The average enterprise TA team now uses between eight and fifteen tools, each of which introduces a handoff that the official process document does not capture, and each of which creates a queue where candidates wait without anyone knowing they are waiting. According to McKinsey research on talent operations, the gap between documented process cycle time and actual process cycle time in talent acquisition averages thirty-seven percent, which means that for a process documented at thirty days, the actual cycle time is closer to forty-one days, and the eleven-day gap is invisible to the team because the official process document does not acknowledge the steps that produce it. The map is the artifact that closes the gap and makes the invisible cycle time visible, which is the precondition for any improvement that targets the actual process rather than the documented one.
The companies that have invested in process mapping report improvements that go beyond cycle time. According to SHRM research on talent acquisition process, companies that have completed a full process mapping exercise report a twenty-eight percent improvement in hiring manager satisfaction, because the map reveals the handoffs that hiring managers were not aware of and enables the team to redesign them, and a thirty-two percent improvement in recruiter productivity, because the map reveals the duplicate work and unnecessary steps that recruiters were performing without realizing they were not adding value. The map is not just a diagnostic tool—it is a communication tool that aligns the team around a shared understanding of the process, and the alignment is what produces the improvements that no individual recruiter could produce alone. As our analysis of more tools same hiring problems argues, the teams that have struggled most with scaling their hiring are the ones that have added tools without mapping the process the tools were supposed to support, and the tools have produced a process that is more complex and less visible than the one they replaced.
The Seven Phases Every Recruitment Map Must Capture
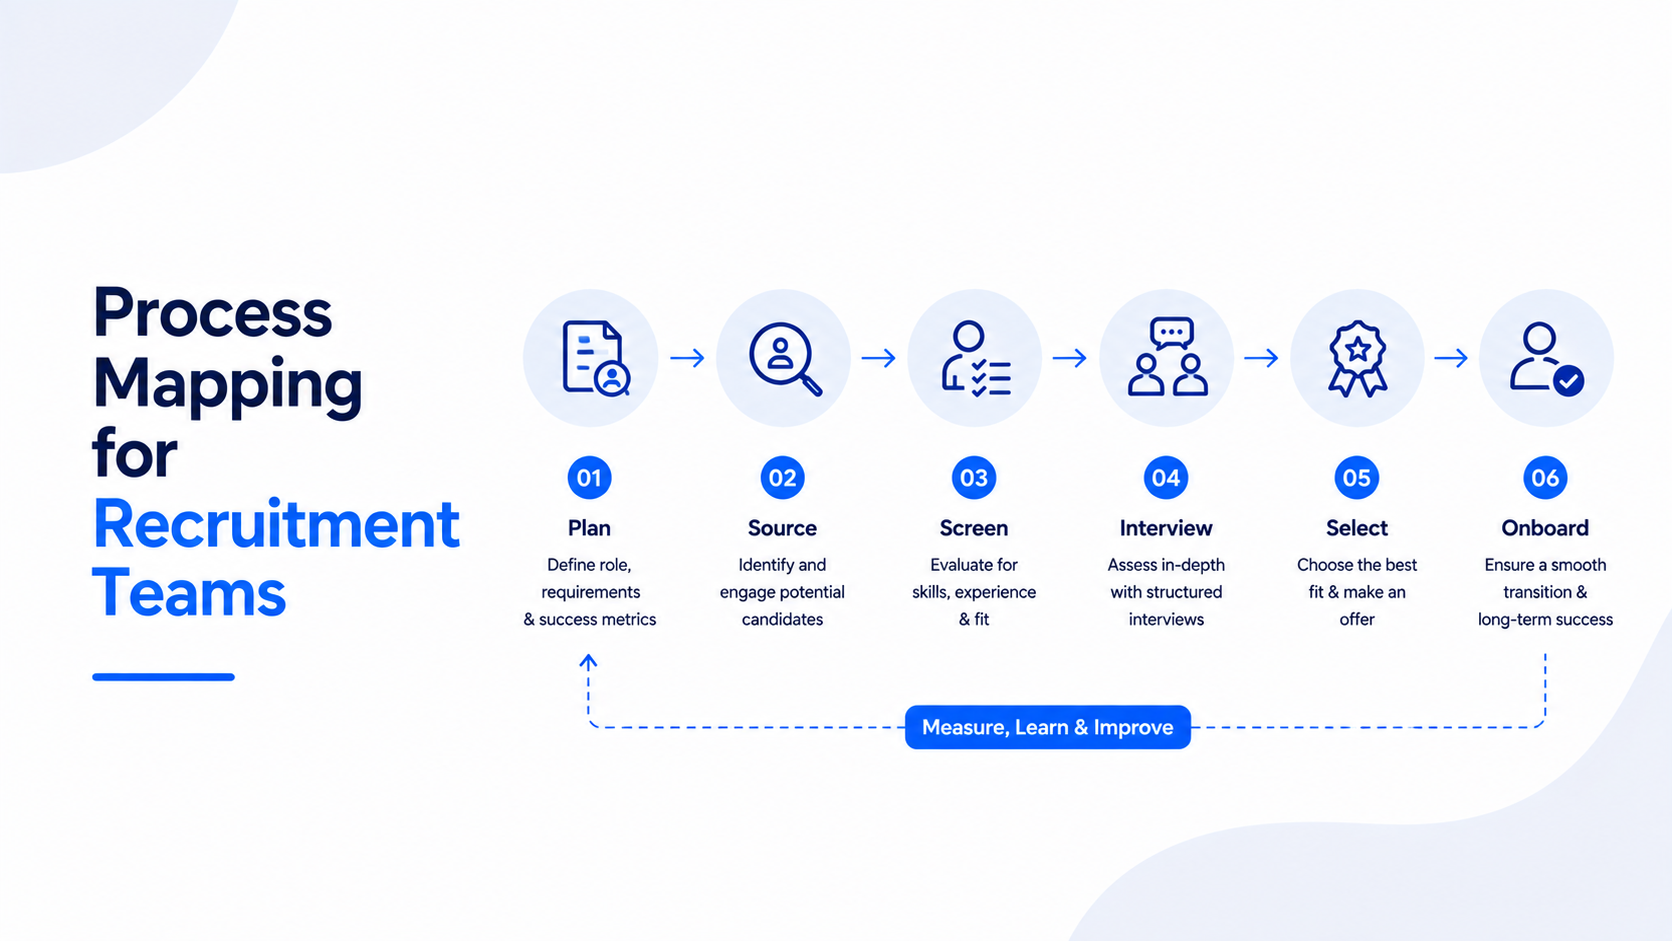
A recruitment process map must capture seven phases: requisition intake, sourcing, screening, interview, decision, offer, onboarding. Each phase must be documented with its inputs, its outputs, its owners, its tools, its cycle time, and its conversion rate, because a map that captures only some of these dimensions is a map that hides the defects it is supposed to reveal. The seven-phase architecture is not a generic framework imposed from outside—it is the structure that emerges from any honest documentation of how hiring actually works, because every requisition that becomes a hire passes through these seven phases regardless of whether the team has documented them, and the phases that have not been documented are the phases where the cycle time is hiding and where the defects are accumulating.
The first phase to map is requisition intake, because the defects at this phase cascade through every downstream phase. The intake map must capture who requests the requisition, who approves it, what information is required before the recruiter can begin sourcing, and how long each step takes. According to Gartner talent acquisition research, the average requisition intake takes eleven calendar days at companies that have not mapped it and four days at companies that have, because the map reveals the approval steps that were not adding value and the team eliminates them. The intake map also reveals the information gaps that require recruiters to follow up with hiring managers, and these follow-ups are typically the largest single source of intake cycle time, because each follow-up adds days to the intake phase that the official process document does not acknowledge and that the recruiter has to absorb through personal effort rather than through a process that ensures the information is captured at the start.
The remaining six phases follow the same documentation discipline. The sourcing map captures the channels used, the candidates generated per channel, and the response rate per channel. The screening map captures the applications received, the screening criteria, the time per application, and the qualified-candidate yield. The interview map captures the rounds, the interviewers, the structure of each round, and the time between rounds. The decision map captures the decision rights, the calibration process, and the time from final interview to decision. The offer map captures the approval chain, the compensation calibration, and the time from decision to offer. The onboarding map captures the handoffs from recruiting to HR to hiring manager, and the time from offer acceptance to start date. Each phase produces a map that the team can analyze independently, and the seven maps together produce a complete picture of the hiring process that no single dashboard can provide, because dashboards report metrics while maps reveal the process that produces the metrics, and the process is where the improvement opportunities live.
How to Run a Process Mapping Workshop with Your Team
A process mapping workshop is the most effective way to produce an accurate map, because the map that is produced by one person in a room is always incomplete, and the map that is produced by the team that runs the process is always more accurate than the map produced by anyone working alone. The workshop should include the recruiters who run the process, the hiring managers who receive the process, and the operations team that supports the process, because each of these stakeholders sees a different part of the process and each holds information that the others do not have. The workshop should be facilitated by someone who is not in the process, because the facilitator's job is to ask the questions that the people in the process have stopped asking, and the people in the process have stopped asking those questions because the steps have become invisible to them through repetition and habit.
The first workshop exercise is to map the process as it actually runs, not as it is documented. Each participant writes each step of the process on a sticky note, including the steps that are not in the official process document, and the sticky notes are arranged in sequence on a wall. The exercise typically reveals between thirty and forty steps for a process that the official document describes in ten, because the official document omits the workarounds, the escalations, and the unofficial handoffs that the team has accumulated over time. According to Deloitte workforce analytics, the gap between documented and actual process steps averages two point seven times, which means that a process documented at twelve steps typically runs at thirty-two steps, and the twenty undocumented steps are where the cycle time and the defects are hiding. The workshop is the only reliable way to surface these undocumented steps, because the people who execute them do not think to mention them unless they are asked in a setting that explicitly invites the documentation of how the process actually works.
The second workshop exercise is to add cycle time to each step. For each sticky note, the team estimates the calendar time the step takes, including the waiting time between steps, because the waiting time is typically larger than the work time, and the waiting time is what the official process document most consistently underestimates. The exercise produces a cycle time map that almost always reveals a process whose total cycle time is significantly longer than the team's reported time-to-fill, because the reported time-to-fill is usually measured from a starting point that excludes the intake and the waiting, and the workshop forces the team to include these phases in the measurement. As our analysis of agentic AI platforms vs automated ones shows, the platforms that produce the greatest operational improvement are those that are implemented after a process mapping workshop has revealed the actual process, because the implementation targets the actual process rather than the documented process, and the actual process is where the improvement opportunities are largest.
Identifying Bottlenecks, Handoffs, and Hidden Queues
The map reveals three classes of defect that no other diagnostic can surface: bottlenecks, handoffs, and hidden queues. A bottleneck is a step whose capacity is lower than the demand on it, which means the step determines the throughput of the entire process. A handoff is a transition between owners, which means a moment when the work passes from one person to another and a moment when the work can be delayed or lost. A hidden queue is a wait between steps that no one owns, which means a wait that no one is responsible for minimizing. The bottleneck limits the speed of the process, the handoff creates the opportunity for delay, and the hidden queue absorbs the delay without anyone knowing, and the three together produce the cycle time that no one can explain and that no individual recruiter can reduce through personal effort.
The bottleneck analysis begins by identifying the step whose capacity is lowest relative to its demand. The interview scheduling step is a common bottleneck, because the hiring manager's calendar has finite availability and the demand on it grows with the number of open requisitions. According to EY research on hiring process efficiency, interview scheduling is the bottleneck in sixty-five percent of enterprise TA processes, and the bottleneck is invisible to the team because the scheduling delays are absorbed by the candidate's patience rather than reported as a process defect. The map reveals the bottleneck by showing the cycle time of each step, and the step with the longest cycle time is typically the bottleneck, because the cycle time is the queue that forms when capacity is exceeded, and the queue is the visible signal of the bottleneck that the team has been living with without recognizing it as a process defect rather than a fact of life.
The handoff and hidden queue analysis requires the team to look at each transition between steps and to ask who owns the wait. Most handoffs have no owner, which means the wait between the handoff and the next step is unowned and therefore unmanaged, and the unmanaged wait is what produces the cycle time that no one can explain. The map makes the unowned waits visible, and the visibility is the first step to assigning ownership, because a wait that is visible can be owned and a wait that is owned can be minimized, while a wait that is invisible continues to absorb cycle time without anyone being accountable for reducing it. As our guide on how to evaluate an AI sourcing tool explains, the most effective tool investments are those that automate the handoffs and eliminate the hidden queues, because the automation removes the unowned waits and produces a process whose cycle time is the sum of its work time rather than the sum of its work time plus its unowned waits, which is the difference between a process that runs in two weeks and a process that runs in six.
From Map to Redesign: Turning Visibility into Improvement
A map is not an improvement. It is the precondition for improvement, because the improvement must target a specific defect, and the defect must be visible before it can be targeted. The redesign phase begins by ranking the defects revealed by the map in order of their cycle time contribution, because the largest cycle time contributor is the defect whose elimination produces the largest improvement, and the redesign effort should be concentrated on the defects that matter rather than distributed across the defects that are easy to fix. The ranking is the prioritization that turns the map into an improvement roadmap, and the prioritization is what separates the teams that improve from the teams that document, because documentation without prioritization produces a map that no one acts on and that becomes obsolete within a quarter as the process continues to evolve.
The first redesign principle is to attack the largest cycle time contributor, not the most visible defect. The most visible defect is typically the one that produces the most recruiter complaints, which is usually a step that is annoying but not slow, while the largest cycle time contributor is typically a hidden queue that no one mentions because no one sees it. The map reveals the largest contributor, and the redesign should target it first, because the improvement from eliminating the largest contributor is larger than the improvement from eliminating any number of smaller contributors, and the redesign effort that targets the largest contributor produces the largest return on the time invested in the redesign work. According to LinkedIn talent research, teams that have redesigned their largest cycle time contributor first have reported forty-five percent cycle time improvements within one quarter, while teams that have distributed their redesign effort across multiple defects have reported twelve percent improvements, because the concentrated effort produces a larger improvement than the distributed effort regardless of the total time invested.
The second redesign principle is to redesign the phase, not the step. A phase is a sequence of steps that produces a defined output, and the phase's cycle time is the sum of its steps plus its handoffs. Redesigning a single step within a phase rarely produces a significant cycle time improvement, because the other steps and handoffs in the phase absorb the improvement, and the phase's cycle time remains largely unchanged. Redesigning the phase end to end produces a significant improvement, because the redesign can eliminate the handoffs and the duplicate work that the step-level redesign cannot address. As our analysis of AI sourcing vs AI recruiting explains, the platforms that produce the greatest cycle time improvement are those that enable phase-level redesign rather than step-level automation, because the phase is the unit of cycle time and the step is not, and the redesign that targets the phase produces the improvement that the redesign targeting the step cannot.
Common Process Mapping Mistakes That Recruitment Teams Make
The most common process mapping mistake is mapping the process as it should be rather than as it is. The team sits down to map the process and produces the process they wish they were running, which is the process described in the official process document, and the map is therefore useless because it documents a process that does not exist. The accurate map documents the process that the team is actually running, including the workarounds, the unofficial steps, and the steps that the official document describes but that the team has stopped doing because they were not adding value. The accurate map is uncomfortable to produce, because it requires the team to acknowledge the gap between the documented process and the actual process, and the gap is often a measure of how much the team has been working around the process rather than within it.
The second common mistake is mapping the process once and never updating the map. A process map is a snapshot, and the snapshot becomes stale within a quarter as the team adapts the process to changing conditions. The team that maps the process once and treats the map as a permanent document is the team that is making decisions based on stale information, and the decisions made on stale information are no better than the decisions made on no information. According to Gartner talent acquisition research, the half-life of a process map in talent acquisition is approximately four months, because the team makes small adaptations to the process every week in response to specific requisitions, and the cumulative effect of these adaptations is a process that diverges from the map within a quarter. The map must be updated quarterly to remain accurate, and the quarterly update is what keeps the map as a living document rather than a historical artifact that no one consults because no one trusts it to reflect the current process.
The third common mistake is treating the map as a deliverable rather than as a tool. The map is a tool for improvement, and its value is measured by the improvements it enables rather than by its existence. A team that produces a beautiful map and files it in a shared drive has produced a document, not an improvement, and the document will not produce a single day of cycle time reduction unless the team uses it to redesign the process. The map must be paired with a redesign commitment, and the redesign must be scheduled and owned, because the map without the redesign is a diagnostic without a treatment, and the diagnostic without the treatment does not improve the patient. As our analysis of the recruiting dashboard every TA team needs shows, the teams that produce the most useful dashboards are the ones that pair the dashboard with a regular review cadence, and the same is true of process maps—the teams that produce the most useful maps are the ones that pair the map with a regular redesign cadence, because the cadence is what turns the map from a document into an improvement tool.
Sustaining the Map as a Living Operational Document
A process map that is sustained as a living document is a process map that produces compounding improvement over time, because each quarterly update reveals new defects, and each redesign eliminates the defects revealed, and the process improves every quarter rather than degrading every quarter. The discipline that sustains the map is the quarterly workflow review, where the team gathers to update the map, to review the metrics that the map predicts, and to decide which defect to redesign next. The review is the cadence that keeps the map alive, because the team knows that the map will be reviewed and that the review will produce redesign work, and the knowledge creates the incentive to keep the map accurate rather than to let it decay into a historical document that no one trusts and that no one uses to drive improvement.
The first sustaining practice is to assign an owner to the map, because a map with no owner is a map that no one updates, and a map that no one updates is a map that becomes stale, and a stale map is worse than no map because it produces decisions based on inaccurate information. The owner of the map is the operations team, not the recruiters, because the recruiters are running the process and do not have time to document it, while the operations team owns the process design and is therefore in the best position to maintain the documentation. According to McKinsey research on talent operations, companies with dedicated operations owners for the process map report fifty percent faster improvement cycles, because the dedicated owner ensures that the map is updated, that the metrics are reviewed, and that the redesigns are scheduled and executed, which is the discipline that produces the compounding improvement that the map enables.
The second sustaining practice is to use the map as the basis for every process decision, because a decision that is not based on the map is a decision that is based on intuition, and intuition is unreliable in a process as complex as hiring. The decision to add a tool, to change a step, to introduce a new role, to modify a handoff—all of these decisions should be made against the map, because the map reveals the impact of the decision on the rest of the process, and the decision that ignores the rest of the process is the decision that produces a local improvement and a global degradation. The team that uses the map as the basis for every process decision is the team that produces improvements that compound rather than improvements that cancel each other out, and the compounding improvement is what the map exists to produce. Process mapping is not a one-time exercise. It is an operational discipline, and the teams that practice it as a discipline are the ones whose hiring processes improve every quarter while their competitors' processes degrade every quarter under the weight of the tools and the steps that no one has ever mapped.