A decade ago, measuring recruiter productivity was simple. You counted how many hires a recruiter made in a month, compared it to the team average, and moved on. The recruiter who closed 12 requisitions was more productive than the one who closed eight. That was the entire framework. No nuance, no context, no adjustment for role difficulty or market conditions. The assumption was that every requisition was roughly equivalent and every recruiter had access to the same candidate pool. None of that was true then, and it is even less true now. The talent market has fragmented, the tools available to recruiters have multiplied, and the expectations placed on talent acquisition have expanded from operational fulfillment to strategic workforce planning. Yet most TA leaders are still using the same output-based measurement system that was designed for a fundamentally different era of recruiting. The result is a measurement approach that incentivizes the wrong behaviors, penalizes recruiters working on the hardest searches, and provides no actionable insight into how to improve. This post outlines a modern framework for measuring recruiter productivity—one that balances efficiency with quality, accounts for context, and drives the behaviors that actually build high-performing teams.
Why Traditional Recruiter Metrics Fall Short
The traditional approach to recruiter productivity measurement relies almost exclusively on output metrics: number of hires, time-to-fill, and requisitions closed. These metrics are appealing because they are easy to collect, simple to understand, and appear objective. But they suffer from a fundamental flaw: they measure what happened, not whether it was the right outcome. A recruiter who fills 15 easy-to-hire roles in a month looks highly productive by output standards. A recruiter who spends the same month filling three difficult-to-hire senior engineering roles looks far less productive. Yet the business impact of those three senior hires almost certainly exceeds the impact of the 15 easy ones. The output metric is accurate—15 is more than three—but it is measuring the wrong thing.
SHRM talent acquisition surveys consistently show that over 60 percent of TA organizations still use hires-per-month or hires-per-quarter as their primary recruiter productivity metric. This is despite the fact that nearly every TA leader surveyed agrees that not all requisitions are equal in difficulty or business impact. The persistence of volume-based measurement is not because leaders believe it is the best approach. It is because building a more sophisticated measurement system requires data that most TA teams do not have readily available—quality-of-hire data, role-difficulty ratings, market competitiveness scores, and hiring manager satisfaction data. Without these inputs, volume becomes the default because it is the only number that is universally available.
The consequences of output-only measurement extend beyond unfair comparisons. When recruiters are measured primarily by headcount, they are incentivized to gravitate toward the easiest requisitions, avoid difficult searches, and prioritize speed over quality. This creates a systemic bias in the recruiting function where the hardest-to-fill roles—the ones the business needs most—receive the least attention because they make the recruiter's numbers look bad. McKinsey talent management research has documented this dynamic extensively, noting that companies with volume-only recruiter metrics are significantly more likely to report difficulty filling critical roles and significantly less likely to report high quality-of-hire scores. The measurement system, not the recruiters, is the problem.
Output vs. Outcome: The Productivity Mindset Shift
The most important conceptual shift in measuring recruiter productivity is moving from output metrics to outcome metrics. Output tells you how much a recruiter did. Outcome tells you how much value that activity created. A hire is an output. A hire who performs in the top quartile, stays for more than two years, and ramps to full productivity within 60 days is an outcome. The distinction matters because it changes the entire frame of reference for evaluating recruiter performance. When you measure outcomes, a recruiter who makes fewer hires but with significantly better results is recognized as more productive than a recruiter who fills more seats with lower-quality results. This shift is not theoretical. It is the direction that the most data-driven TA organizations are already moving.
Gartner predicts that by 2027, at least 40 percent of large enterprises will have replaced volume-based recruiter metrics with outcome-weighted productivity models, up from less than 15 percent today. The early adopters of this approach are reporting significant improvements in both quality-of-hire and recruiter engagement. When recruiters are measured on the quality and impact of their hires rather than just the count, they make different decisions. They spend more time on candidate assessment, provide more detailed briefs to hiring managers, and are more selective about which candidates they advance. The irony is that these quality-focused behaviors often lead to better hiring outcomes without any decrease in volume, because better matching reduces early turnover and the need for costly re-hires.
Implementing an outcome-based productivity framework requires a broader set of data inputs than most TA teams currently collect. At minimum, you need first-year performance ratings, retention data at 6 and 12 months, and hiring manager satisfaction scores for each hire, linked back to the recruiter who managed the search. This data integration—connecting recruiting outcomes to post-hire performance—is the biggest technical barrier to outcome-based measurement. But it is not insurmountable. The companies that have solved it typically start with a manual quarterly review, collecting performance and retention data from HRIS and matching it to recruiter records in the ATS. Over time, this process is automated through data pipelines or unified analytics platforms. The key is starting simple and iterating, rather than waiting for a perfect data infrastructure that may never arrive. Many TA teams find that their existing tool stack already generates the data they need but it is siloed across systems that nobody has taken the time to connect.
The Core Metrics Every Recruiter Should Be Measured On
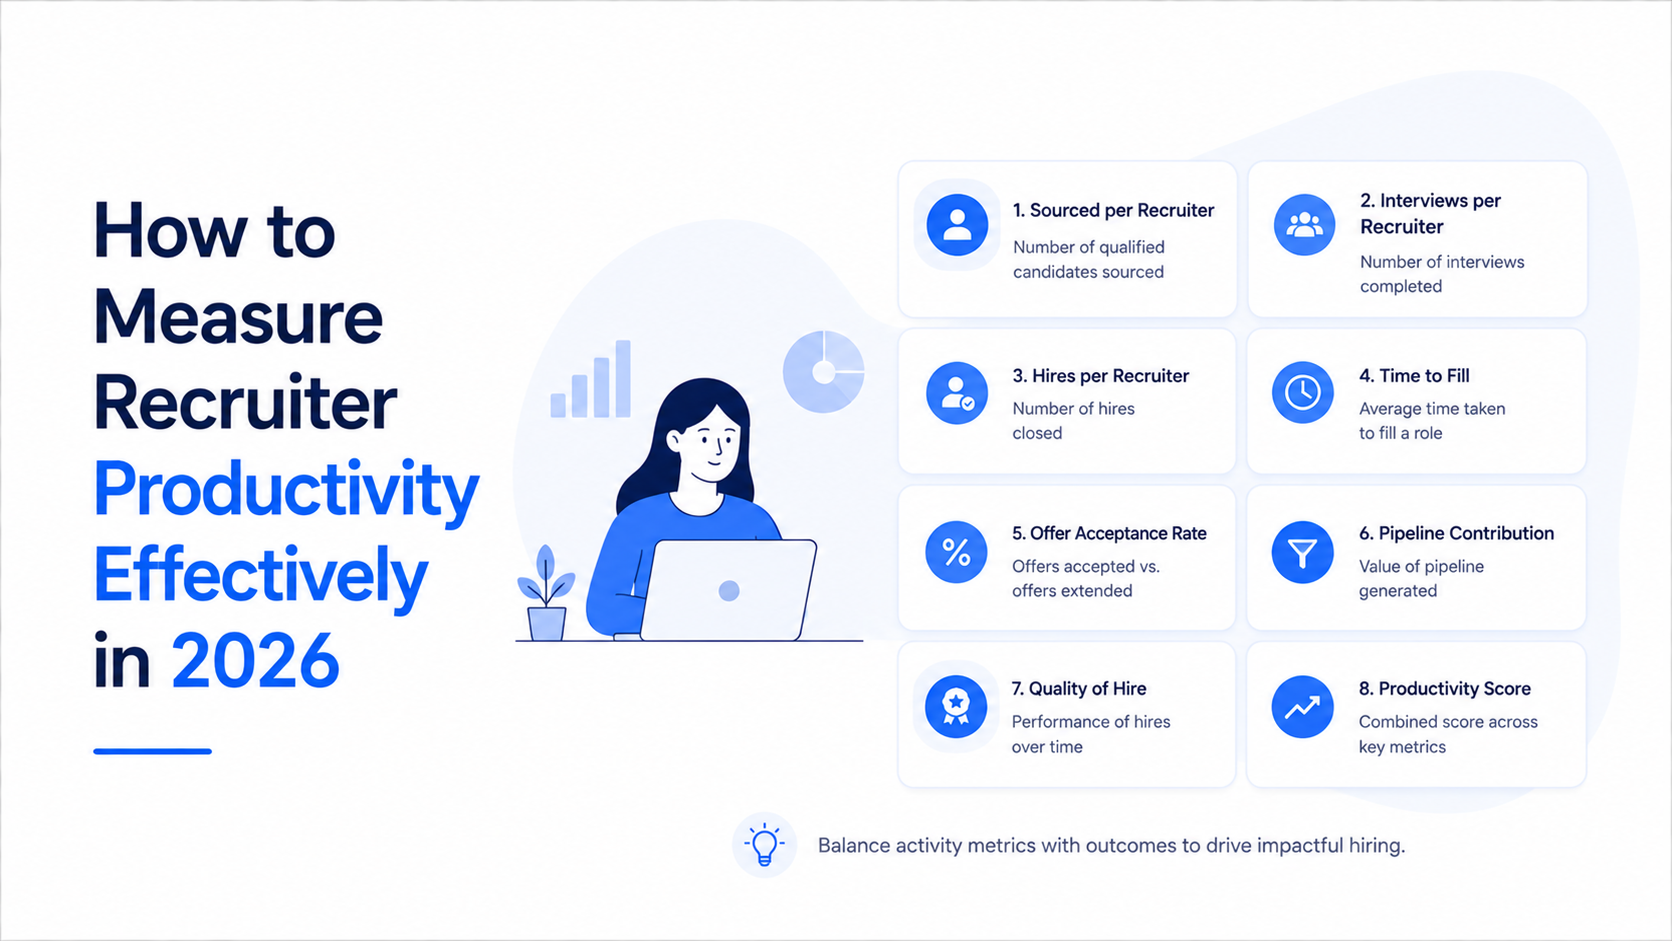
A modern recruiter productivity measurement system should include a balanced set of metrics that capture efficiency, quality, and stakeholder satisfaction. No single metric tells the full story, which is why the most effective systems use a composite scorecard with four to six weighted metrics. The first metric is qualified hires per month—similar to traditional headcount counts but filtered to include only hires who pass a defined quality threshold, such as a minimum first-year performance rating or completion of the probation period. This immediately differentiates between a recruiter who fills seats and one who fills them with people who perform.
The second metric is quality-of-hire index, which aggregates post-hire performance data into a single score for each recruiter's hires. This index typically combines first-year performance ratings, ramp time, and retention into a weighted composite. LinkedIn talent reports show that organizations tracking quality-of-hire at the individual recruiter level are able to identify their strongest talent matchmakers—the recruiters who consistently produce high-performing hires—and deploy them on the most business-critical searches. This targeted deployment of top recruiting talent is one of the highest-leverage moves a TA leader can make, but it is only possible when you have recruiter-level quality data.
The third metric is sourcing efficiency, measured as the number of qualified candidates presented per sourcing hour invested. This metric captures how effectively a recruiter uses their time in the market. A recruiter who generates five qualified candidates per hour of sourcing effort is dramatically more efficient than one who generates one per hour, even if both end up making the same number of hires. The difference is that the efficient recruiter has more time to spend on assessment, relationship building, and offer management. Understanding the distinction between AI sourcing and AI recruiting is critical here, because the tools a recruiter uses directly affect their sourcing efficiency. Recruiters equipped with high-quality AI sourcing tools consistently outperform those relying on manual methods, not because they work harder, but because the technology amplifies their reach and targeting precision.
Activity Metrics That Still Matter
While the shift toward outcome-based measurement is important, activity metrics have not become irrelevant. They have simply been repositioned as leading indicators rather than primary productivity measures. The key activity metrics that still provide value when used correctly include outreach volume and response rate, interview scheduling efficiency, candidate pipeline coverage ratio, and time-to-first-response for inbound candidates. Each of these metrics provides an early signal about whether a recruiter is generating enough activity to eventually produce the desired outcomes. A recruiter with a strong quality-of-hire index but declining outreach volume is likely to see their results deteriorate in the next quarter as their pipeline dries up.
The critical discipline with activity metrics is using them as coaching inputs rather than performance evaluations. Deloitte HR analytics research emphasizes that activity metrics are most valuable when they are reviewed in one-on-one coaching sessions between recruiters and their managers, used to identify process bottlenecks and skill gaps. For example, a recruiter with a low outreach response rate might need coaching on messaging personalization or timing. A recruiter with a low pipeline coverage ratio might need help identifying new sourcing channels or improving their boolean search techniques. In both cases, the activity metric is a diagnostic tool, not a judgment.
The danger of activity metrics emerges when they are used as standalone productivity measures. Measuring a recruiter by the number of calls they make or emails they send incentivizes volume over quality, which leads to the spray-and-pray behavior that gives recruiting a poor reputation among candidates. EY talent acquisition studies have found that recruiters who are measured primarily by activity volume have 25 to 35 percent lower candidate satisfaction scores than those measured by outcome-based metrics. The candidates can tell the difference between a recruiter who is genuinely engaging with them and one who is checking a box. When your measurement system incentivizes the latter, your employer brand and candidate experience suffer in ways that are difficult and expensive to reverse.
Quality-Weighted Productivity: The Missing Dimension
Quality-weighted productivity is the metric that bridges the gap between output and outcome. The concept is straightforward: instead of counting each hire as one unit, assign each hire a quality weight based on post-hire performance, and then sum the weighted hires to produce a quality-adjusted productivity score. For example, a hire who performs in the top quartile and is retained at 12 months might receive a weight of 1.5, while a hire who performs below expectations and leaves within six months receives a weight of 0.5. A recruiter who makes 10 hires with an average quality weight of 1.3 has a quality-weighted productivity score of 13.0, compared to a recruiter who makes 12 hires with an average weight of 0.9, producing a score of 10.8. The first recruiter made fewer hires but delivered significantly more value.
This approach requires a quality scoring rubric that is transparent and consistently applied. The most practical version uses data that is already available in most organizations: first-year performance rating and 12-month retention status. A simple rubric might assign a weight of 1.0 for hires rated "meets expectations" who are still employed at 12 months, 1.5 for "exceeds expectations," 0.5 for "below expectations," and 0.0 for early departures. Gartner case studies on talent analytics show that even this basic weighting system produces a dramatically different—and more accurate—picture of recruiter productivity than raw headcount alone. In one case study, a recruiter who appeared to be the lowest performer by hire volume was actually the highest performer by quality-weighted productivity, because every hire they made was retained and performing well.
The most sophisticated versions of quality-weighted productivity also factor in the business impact of the role. A senior engineer hire who drives a key product launch is not equivalent to a junior coordinator hire, even if both receive the same performance rating. Role-level impact multipliers can be applied on top of the individual quality weight to produce a composite score that captures both the quality of the hire and the strategic importance of the role. This is the level of precision that transforms recruiter productivity measurement from a backward-looking reporting exercise into a forward-looking strategic tool. When TA leaders can show their CEOs that their top recruiters are not just filling seats but filling the most business-critical seats with the highest-performing talent, the conversation about recruiting investment changes fundamentally.
How to Account for Role Complexity and Market Difficulty
Any fair recruiter productivity measurement system must account for the fact that not all requisitions are created equal. A recruiter filling a junior marketing role in a major city with a strong employer brand is operating under fundamentally different conditions than a recruiter filling a senior data scientist role in a niche market where the company has little brand presence. Failing to adjust for these differences punishes recruiters who take on the hardest work and rewards those who cherry-pick easy assignments. The solution is a role-complexity adjustment that normalizes productivity scores based on the difficulty of the requisitions a recruiter is handling.
Role complexity can be assessed along several dimensions: seniority level, market competitiveness for the required skills, geographic talent availability, employer brand strength in the relevant talent market, and compensation competitiveness relative to market rates. Each dimension can be scored on a simple scale—low, medium, high—and the scores can be combined into a single difficulty rating for each requisition. McKinsey talent acquisition benchmarks provide reference data for the typical fill rates and time-to-fill for different role-complexity levels, which can be used to calibrate the adjustment factors. A recruiter working primarily on high-complexity roles might have their productivity scores adjusted upward by 20 to 30 percent to reflect the additional difficulty, ensuring that their results are evaluated on a level playing field.
The practical implementation of role-complexity adjustments does not need to be mathematically precise to be useful. Even a simple three-tier classification—standard, challenging, and critical—applied consistently across the team provides a meaningful correction. What matters is that the classification is transparent, agreed upon with recruiters and hiring managers, and applied before the hiring process begins rather than after the fact. When recruiters know that working on the hardest searches will be recognized and accounted for in their productivity scores, they are far more willing to take on those assignments. This is particularly important for AI sourcing tools, because the effectiveness of these tools varies significantly by role complexity. Tools that dramatically improve sourcing efficiency for standard roles may provide less advantage for highly specialized or senior searches, and the productivity measurement system should reflect that reality.
Building a Recruiter Scorecard That Drives the Right Behavior
The most effective approach to measuring recruiter productivity is a balanced scorecard that combines multiple metrics into a single framework. A well-designed scorecard typically includes four categories: efficiency metrics like time-to-fill and sourcing hours per hire, quality metrics like quality-weighted productivity and first-year retention, experience metrics like candidate satisfaction and hiring manager satisfaction, and growth metrics like skills development and process improvement contributions. Each category is weighted based on organizational priorities—if the company is in a rapid growth phase, efficiency might carry more weight; if it is focused on building a high-performance culture, quality might dominate.
SHRM best practices recommend keeping the scorecard to five or six metrics maximum. More than that, and the measurement system becomes too complex for recruiters to understand and act on. The metrics should be visible to each recruiter on at least a monthly basis, with quarterly deep-dive reviews that examine trends and identify coaching opportunities. Transparency is essential—recruiters should be able to see their own scores, the team average, and the benchmark range, so they understand where they stand and what they need to improve. Hidden metrics breed distrust. Visible metrics drive accountability.
The scorecard should also include a qualitative component. Recruiting is a relationship-driven profession, and some of the most valuable contributions a recruiter makes—the hiring manager consultation that prevents a bad requisition from being posted, the market intelligence that shapes the compensation strategy, the candidate relationship that pays off six months later—are difficult to capture in quantitative metrics. Including a brief qualitative assessment from hiring managers and peers ensures that the full scope of a recruiter's contribution is recognized. Deloitte research on talent management consistently finds that the most engaged and highest-performing recruiters work in organizations where they feel their contribution is evaluated holistically, not reduced to a single number. The scorecard is a tool for development, not a weapon for punishment. When it is designed and used with that principle in mind, it transforms recruiter productivity measurement from a source of anxiety into a source of motivation.
Using Productivity Data to Coach, Not Punish
The final and most important principle in measuring recruiter productivity is that the data must be used for coaching and development, not for ranking and penalizing. When productivity metrics are used primarily to identify underperformers for disciplinary action or performance improvement plans, the entire system breaks down. Recruiters become risk-averse, avoiding difficult searches and gravitating toward safe, volume-boosting assignments. They game the metrics by closing easy requisitions quickly and deprioritizing the searches that matter most to the business. The measurement system becomes a self-fulfilling prophecy that rewards the wrong behaviors and drives the best recruiters to leave.
LinkedIn research on recruiter engagement shows that the number one predictor of recruiter retention is whether they feel their manager uses performance data to help them improve rather than to judge them. In organizations where productivity data is used primarily for coaching, recruiter turnover is 30 to 40 percent lower than in organizations where the same data is used primarily for evaluation. The coaching approach means that when a recruiter's quality-weighted productivity score drops, the manager's first question is "What is getting in your way?" rather than "Why are your numbers down?" This simple reframing changes the entire dynamic of the performance conversation and creates the psychological safety that recruiters need to be honest about their challenges.
The coaching framework should follow a consistent structure. First, review the data together and identify the specific metric or metrics that need attention. Second, diagnose the root cause—is it a skills gap, a process problem, a tooling issue, or a market condition? Third, agree on one or two specific actions the recruiter will take to address the gap. Fourth, set a follow-up date to review progress. This cycle should repeat monthly, creating a rhythm of continuous improvement that feels supportive rather than punitive. When this coaching cadence is in place, productivity measurement becomes what it was always meant to be: a tool for helping recruiters do their best work, not a scoreboard for ranking them against each other. The teams that adopt agentic AI platforms to automate routine tasks are finding that their recruiters have more time for the high-value activities that drive quality-weighted productivity, making the coaching conversation about strategic impact rather than process compliance.