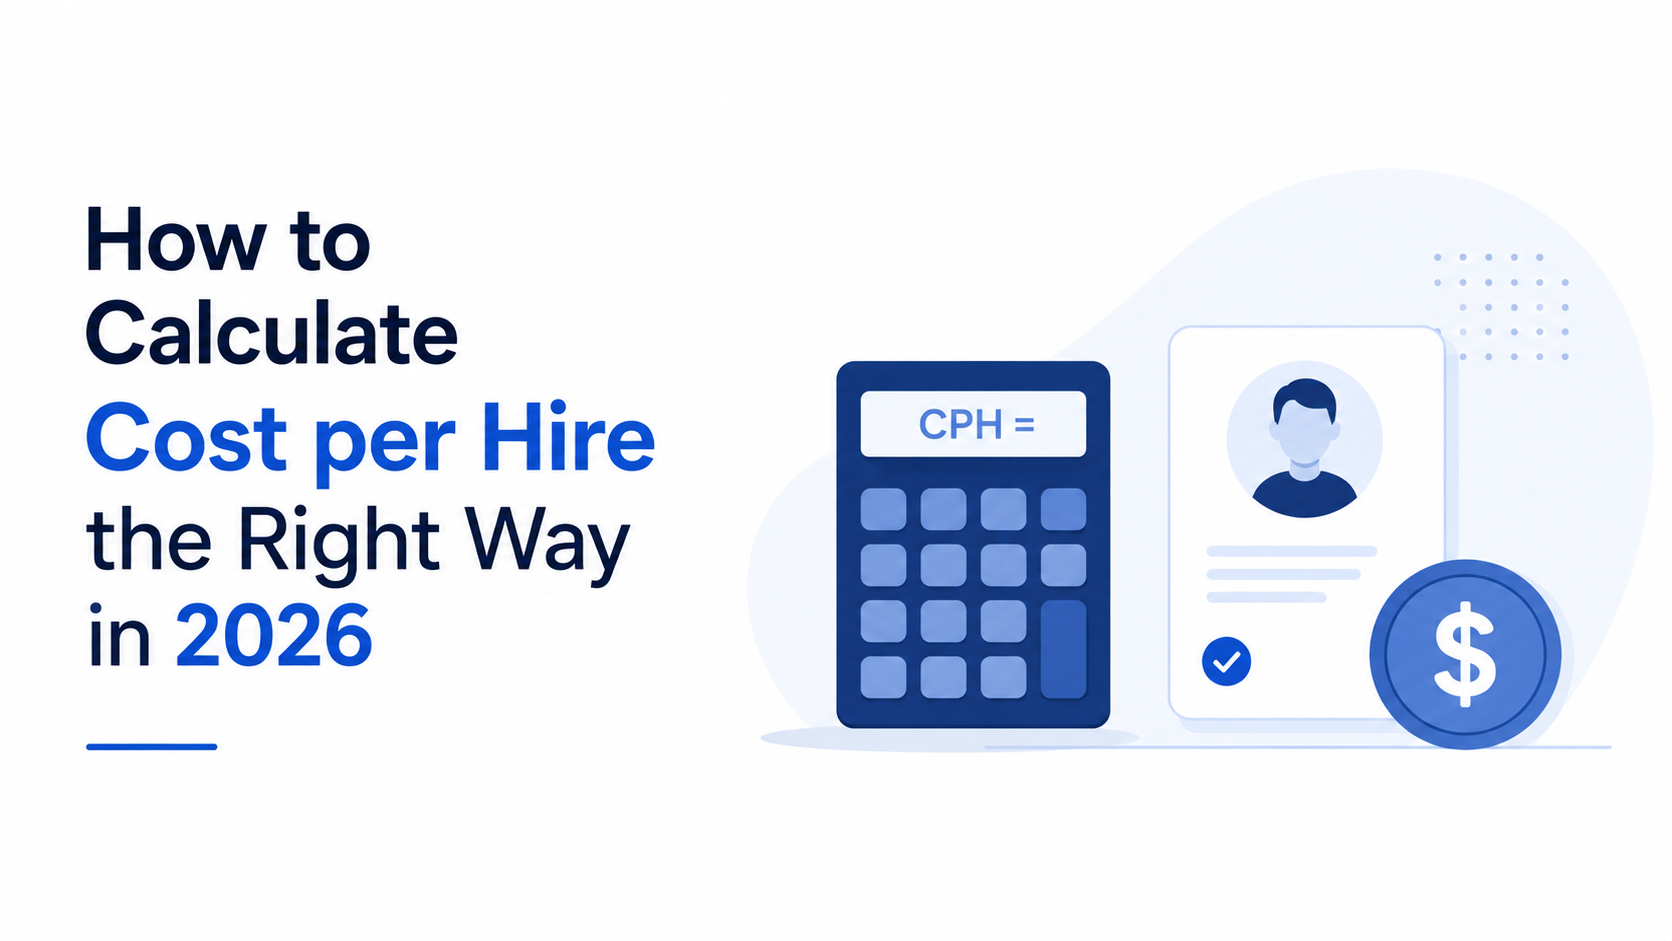
The Society for Human Resource Management publishes a cost-per-hire formula that has become the de facto standard for the talent acquisition industry. It is elegant in its simplicity: add all internal recruiting costs and all external recruiting costs, divide by the number of hires, and you have your cost per hire. The formula is taught in HR certification programs, embedded in ATS dashboards, and cited in board presentations. It is also, by a significant margin, the most frequently miscalculated metric in recruiting. The problem is not the formula itself but the way organizations implement it. Most talent teams define internal costs as recruiting team compensation and external costs as agency fees and job board spend, then stop counting. They exclude the time hiring managers spend interviewing, the productivity cost of unfilled roles, the technology infrastructure that supports recruiting, and the onboarding investment that determines whether a hire succeeds or fails within the first year. When these costs are included, the true cost per hire is typically forty to sixty percent higher than the number on the standard dashboard, a gap that fundamentally changes how talent leaders should think about recruiting efficiency and technology investment.
Why the Standard Cost-per-Hire Formula Is Incomplete
The SHRM formula defines internal recruiting costs as salaries and benefits of the recruiting team plus any internal overhead allocated to the recruiting function, and external costs as agency fees, job board advertising, employee referral bonuses, applicant tracking system fees, and relocation costs. This definition was practical when recruiting was a primarily manual function, because the recruiting team's labor was the dominant cost and the external spend was limited to a handful of predictable line items. But AI-augmented recruiting has fundamentally changed the cost structure of talent acquisition. Platforms like Huntlo charge subscription or usage-based fees that can represent thirty to forty percent of total recruiting spend, yet many organizations classify these fees under general technology or operations budgets rather than recruiting costs, which means they never appear in the cost-per-hire calculation. According to SHRM, only forty-one percent of organizations include AI recruiting platform fees in their cost-per-hire calculation, which means the majority are systematically understating one of their largest recruiting expenses.
The second category of costs that the standard formula misses is hiring manager time. The typical hiring manager spends six to eight hours per hire on activities like reviewing resumes, conducting interviews, providing feedback, and participating in calibration meetings. In organizations making two hundred hires per year across fifty hiring managers, this represents roughly fifteen hundred hours of managerial time that is entirely excluded from the standard calculation. According to LinkedIn, hiring manager time is the single largest hidden recruiting cost, accounting for twenty-five to thirty-five percent of total hiring cost when valued at the manager's fully loaded compensation rate. Excluding this cost creates a distorted picture of recruiting efficiency, because it makes the recruiting function appear less expensive than it actually is and it removes the incentive to streamline the evaluation process. Our analysis of more tools same hiring problems shows that organizations that include hiring manager time in their cost-per-hire calculation make significantly different process design decisions, because the visibility of manager time costs creates pressure to reduce the number of interviews and streamline the evaluation workflow.
The third omission is the cost of vacancy, which is the productivity and revenue impact of having a role unfilled. While vacancy cost is not technically a recruiting cost, it provides essential context for interpreting cost per hire. A role that generates two hundred thousand dollars in annual revenue and remains unfilled for forty-five days costs the organization approximately twenty-five thousand dollars in lost productivity. If the cost to fill that role is fifteen thousand dollars, the total cost of the hiring process including vacancy is forty thousand dollars. When vacancy cost is included in the analysis, the return on recruiting investment becomes much clearer and the case for investing in faster, higher-quality hiring becomes much stronger. According to McKinsey, organizations that factor vacancy cost into their recruiting economics make twenty to thirty percent larger investments in recruiting technology and process improvement, because the full cost picture reveals that the cost of under-investing in recruiting far exceeds the cost of over-investing.
The Hidden Costs That Most Organizations Fail to Include
Beyond the three major omission categories, several additional costs are frequently excluded from cost-per-hire calculations in ways that systematically understate the true cost of hiring. The first is employer branding and recruitment marketing spend, which includes career site development, content creation, social media campaigns, event sponsorships, and university recruiting programs. These costs are often budgeted under marketing or employer brand rather than recruiting, which means they never appear in the cost-per-hire numerator even though they directly contribute to candidate flow and hiring outcomes. In organizations with significant employer brand investments, this exclusion can understate cost per hire by ten to fifteen percent. The second is background check and compliance costs, which include verification services, drug screening, reference checking, and the legal and compliance overhead associated with hiring in regulated industries. These costs are typically five hundred to three thousand dollars per hire, and in regulated industries like financial services and healthcare, they can reach five thousand dollars or more per hire.
The third hidden cost is onboarding and early-tenure support, which is the investment required to bring a new hire to full productivity. This includes training programs, mentoring time, equipment and access provisioning, and the productivity ramp-up period during which the new hire is performing below their eventual steady-state output. While onboarding costs are sometimes classified separately from recruiting costs, they are directly connected to the quality of the hiring decision. A poor hiring decision that results in a first-year departure wastes not only the recruiting cost but also the full onboarding investment. According to Deloitte, the average cost of onboarding a new hire is roughly equal to three to six months of the hire's salary, which means that for a role with a one hundred thousand dollar annual salary, the onboarding investment is twenty-five thousand to fifty thousand dollars. When this onboarding cost is attributed to the recruiting function, it changes the economics of quality versus speed dramatically, because a low-quality hire who leaves within six months costs far more than the standard cost-per-hire calculation reveals.
The fourth hidden cost category is the opportunity cost of poor-quality hiring decisions. When a hire underperforms or leaves within the first year, the organization incurs not only the direct cost of replacing that hire but also the indirect cost of the lost productivity, the team disruption, and the project delays that result from having an ineffective person in a critical role. According to EY, the total cost of a bad hiring decision, including replacement costs, productivity loss, and team impact, is typically two to three times the hire's annual salary. This means that a single bad hire at a senior level can cost more than the entire annual recruiting budget for a mid-size organization. The practical implication is that cost per hire should never be evaluated in isolation from quality of hire, because the cheapest hire on a per-unit basis can become the most expensive hire when quality failure costs are included in the analysis.
How AI Recruiting Platforms Change the Cost-per-Hire Calculation
AI recruiting platforms change the cost-per-hire equation in three distinct ways. First, they shift the cost structure from variable to fixed. Traditional recruiting costs are heavily variable: every additional hire requires additional recruiter hours, additional agency fees, and additional advertising spend. AI platforms replace many of these variable costs with a fixed subscription or usage fee, which means the marginal cost of each additional hire decreases as volume increases. An organization making fifty hires per year on a platform with a hundred thousand dollar annual subscription pays two thousand dollars in platform cost per hire. The same organization making two hundred hires pays five hundred dollars per hire in platform cost, a seventy-five percent reduction that dramatically changes the unit economics. According to Gartner, organizations using AI recruiting platforms report thirty to forty percent lower variable cost per hire than organizations relying primarily on manual sourcing and agency recruitment, because the platform absorbs activities that would otherwise require paid human labor or external services.
Second, AI platforms reduce the cost components that are hardest to quantify but often the largest in practice. The most significant of these is the hiring manager time cost, which AI platforms reduce by pre-qualifying candidates, providing structured evaluation frameworks, and automating the scheduling and coordination activities that consume manager hours. Our comparison of AI sourcing vs AI recruiting shows that full-lifecycle AI recruiting platforms reduce hiring manager time per hire by forty to fifty percent compared to sourcing-only tools, because the broader platform capability covers more of the evaluation workflow that would otherwise require manual manager involvement. Third, AI platforms change the relationship between cost per hire and quality of hire. In traditional recruiting, reducing cost per hire typically means reducing quality, because the primary way to cut costs is to source less thoroughly, evaluate less rigorously, or hire from a smaller candidate pool. AI platforms break this trade-off by making high-quality sourcing and evaluation less expensive through automation, which means that organizations can simultaneously reduce cost per hire and improve quality of hire, a combination that was essentially impossible in the pre-AI era.
The net effect of these three changes is that cost-per-hire benchmarks derived from pre-AI recruiting are no longer valid. An organization that achieved a cost per hire of eight thousand dollars using manual recruiting processes cannot meaningfully compare that number to an organization achieving six thousand dollars using an AI-augmented process, because the two numbers represent fundamentally different cost structures with different implications for scalability and quality. As our analysis of agentic AI platforms vs automated ones demonstrates, the most cost-effective AI recruiting operations are those that use AI agents to automate not just candidate identification but also the coordination, communication, and evaluation activities that drive the largest hidden costs, creating a compounding cost advantage that grows with scale.
Cost per Hire vs. Cost per Quality Hire: The Metric That Actually Matters
The most important conceptual shift in recruiting cost measurement is the move from cost per hire to cost per quality hire. Cost per hire treats every hire as equivalent, regardless of whether the hire turns out to be a high performer or a first-year departure. Cost per quality hire divides total recruiting cost by the number of hires who achieve a defined quality threshold, typically measured by performance reviews, retention, and hiring manager satisfaction. The difference between these two metrics is not marginal. In organizations with typical first-year turnover rates of fifteen to twenty percent and performance distribution where roughly thirty percent of hires are rated below expectations, the cost per quality hire is typically forty to sixty percent higher than the cost per hire. This gap represents the hidden cost of quality failure that the standard metric obscures.
According to McKinsey, organizations that track cost per quality hire make fundamentally different investment decisions than those tracking only cost per hire. They invest more in assessment quality, because better assessment reduces the number of low-quality hires and improves the cost per quality hire even when it increases the cost per hire. They invest more in candidate experience, because candidates who have positive experiences are more likely to accept offers and more likely to succeed after joining, which improves both the numerator and the denominator of the cost-per-quality-hire equation. And they invest more in AI platforms that improve matching accuracy, because platforms that produce higher-quality matches reduce the number of failed hires and improve the cost per quality hire even when the platform's subscription cost increases the total recruiting spend. Our guide on how to evaluate an AI sourcing tool provides a framework for assessing which platform capabilities have the greatest impact on cost per quality hire, because the evaluation criteria shift significantly when quality-weighted cost is the target metric rather than raw cost.
The practical challenge with cost per quality hire is that it requires a lagging quality measurement, which means the metric cannot be calculated in real time the way cost per hire can. A hire made in January will not have a quality assessment until April or May, when the ninety-day performance review and hiring manager satisfaction survey are complete. This lag creates a temptation to rely on cost per hire for operational decisions and treat cost per quality hire as a retrospective strategic metric. The most effective organizations resist this temptation by using predictive proxies for quality during the hiring process. AI platforms that can predict candidate success based on behavioral data, skill assessment results, and engagement patterns provide a real-time estimate of quality that can be used to calculate an expected cost per quality hire before the actual quality data is available. This predictive approach enables talent leaders to make cost-quality trade-off decisions during the hiring process rather than discovering months later that their cost optimization produced poor quality outcomes.
A Step-by-Step Framework for Calculating Cost per Hire Accurately
The first step in building an accurate cost-per-hire calculation is to conduct a comprehensive cost inventory that captures every expense category that contributes to hiring. This inventory should include six categories: internal recruiting team compensation and benefits, external recruiting services including agencies and job boards, technology and platform costs including AI recruiting subscriptions, hiring manager time valued at fully loaded compensation rates, employer branding and recruitment marketing spend, and compliance and background check costs. Each category should be calculated quarterly to capture seasonal variation, and the total should be compared against the standard cost-per-hire calculation to quantify the gap. In most organizations, this inventory reveals that the standard calculation captures only fifty-five to sixty-five percent of actual recruiting cost, with the remainder distributed across the hidden categories identified earlier.
The second step is to allocate shared costs accurately. Many recruiting costs are shared across multiple functions or are incurred for purposes that serve both recruiting and broader organizational objectives. Employer branding spend serves both recruiting and general marketing. ATS infrastructure serves both recruiting and HR operations. Conference sponsorships generate both hiring pipeline and business development leads. These shared costs should be allocated to recruiting using a consistent methodology, typically based on the proportion of the activity or spend that is directly attributable to recruiting outcomes. According to LinkedIn, organizations that use consistent allocation methodologies report twenty percent more stable cost-per-hire trends over time, because the consistency eliminates the distortions that occur when shared costs are arbitrarily included or excluded from period to period.
The third step is to segment cost per hire by meaningful dimensions. Aggregate cost per hire is useful for budgeting but nearly useless for decision-making, because it masks enormous variation across role families, seniority levels, geographies, and sourcing channels. A senior engineering hire in San Francisco might cost forty thousand dollars while a customer service hire in Austin costs four thousand dollars. These two numbers have nothing in common and should not be averaged together. The segmented calculation reveals where the recruiting function is spending most, where costs are increasing, and where technology investment or process improvement would have the greatest impact. The most valuable segments for decision-making are role family, because different roles require fundamentally different recruiting approaches; seniority level, because senior hires are dramatically more expensive than junior hires; and sourcing channel, because channel-level cost per hire directly informs where to allocate recruiting budget for maximum efficiency.
How to Use Cost per Hire Data to Make Better Recruiting Decisions
The primary strategic value of an accurate cost-per-hire calculation is not the number itself but the decisions it enables. The first decision the data should inform is technology investment. When an AI recruiting platform's subscription cost is compared against the costs it eliminates, including reduced agency fees, reduced hiring manager time, reduced job board spend, and improved quality that reduces first-year turnover, the investment case typically shows a positive return within six to twelve months. According to Deloitte, organizations that conduct this full-cost comparison before making AI platform investments are thirty percent more likely to achieve their expected return on investment, because the comprehensive cost view prevents them from underestimating the platform's value by comparing its cost only against the narrow set of costs it directly replaces.
The second decision the data should inform is sourcing channel optimization. When cost per hire is segmented by sourcing channel and combined with quality-of-hire data by channel, talent leaders can calculate the cost per quality hire by channel, which is the metric that should drive channel investment decisions. A channel that produces hires at five thousand dollars each with a forty percent quality-failure rate has a cost per quality hire of roughly eight thousand three hundred dollars, while a channel that produces hires at eight thousand dollars each with a ten percent quality-failure rate has a cost per quality hire of roughly eight thousand nine hundred dollars. The raw cost per hire makes the first channel look superior, but the quality-adjusted cost reveals that the channels are nearly equivalent, and when downstream retention and performance effects are included, the second channel may actually be less expensive in total. This analysis fundamentally changes how talent leaders should allocate their sourcing budgets and which channels they should scale versus which they should optimize or eliminate.
The third decision is organizational capacity planning. When cost per hire is tracked over time and segmented by team, the data reveals which recruiting teams are operating most efficiently and which are experiencing cost inflation that may indicate process problems, tooling gaps, or market difficulty. According to Gartner, organizations that use cost-per-hire trend data to identify recruiting teams that need additional support or tooling are twenty-five percent more likely to retain their top recruiters, because early intervention prevents the frustration and burnout that drive recruiter attrition in under-resourced teams. The cost-per-hire data also informs hiring manager education, because managers who understand the full cost of hiring are more likely to invest time in providing timely feedback, participating in calibration sessions, and making prompt decisions, all of which reduce the hidden time costs that inflate the true cost per hire far beyond what the standard dashboard shows.