Consider two talent acquisition teams. Both hire 200 people a year. Both report a time-to-fill of 38 days and a cost-per-hire of $4,800. By every internal metric, these teams look identical. But one operates in a market where the average time-to-fill for similar roles is 52 days and the average cost-per-hire is $7,200. The other operates in a market where the averages are 28 days and $3,500. The first team is significantly outperforming its market. The second team is underperforming by a wide margin. Neither team can see this reality without benchmarking. Internal metrics tell you what is happening inside your organization. Benchmarks tell you whether what is happening is good, bad, or average relative to the context in which you operate. That contextual understanding is what transforms data into insight and insight into strategy. This post provides a practical framework for benchmarking your recruitment performance in a way that produces actionable intelligence rather than misleading comparisons.
What Recruitment Benchmarking Actually Means
Recruitment benchmarking is the process of comparing your hiring metrics against a relevant external reference set to determine whether your performance is above, below, or within a normal range. The emphasis on relevant is critical, because comparing your metrics against the wrong reference set produces conclusions that are worse than having no benchmark at all. A 50-person startup comparing its time-to-fill against a 10,000-person enterprise will reach inaccurate conclusions. A healthcare company comparing its offer acceptance rate against a technology company will misdiagnose its challenges. Relevance means matching on industry, company size, role type, geography, and hiring volume—the dimensions that have the greatest influence on recruiting outcomes.
McKinsey organizational benchmarking research distinguishes between three types of benchmarking, each serving a different purpose. Internal benchmarking compares your current performance against your own historical performance, answering the question "Are we getting better?" Competitive benchmarking compares your metrics against specific competitors, answering "Are we winning in our talent market?" And functional benchmarking compares your metrics against best-in-class performers regardless of industry, answering "What is possible?" Each type has value, but the most common mistake TA teams make is relying exclusively on internal benchmarking—which only tells you whether you are improving—and neglecting the external comparisons that tell you whether improvement is fast enough to keep pace with the market.
The most useful benchmarking data comes in ranges rather than single points. An industry average time-to-fill of 42 days is almost meaningless on its own. But knowing that the 25th percentile is 28 days, the median is 42 days, and the 75th percentile is 58 days tells you exactly where you stand and how much room for improvement exists. Gartner advises TA leaders to focus on percentile ranges rather than averages because averages are heavily influenced by outliers and can mask the distribution of performance across the market. A company at the 40th percentile might be close to the average but still below the majority of its competitors. Ranges provide the nuance that point estimates cannot.
The Data You Need Before You Can Benchmark
Before you can benchmark against external data, you need to know your own numbers with confidence. This sounds obvious, but many TA teams discover significant data quality issues the first time they attempt a serious benchmarking exercise. The most common problems include inconsistent stage definitions across recruiters, incomplete data entry in the ATS, and metrics that are calculated differently from one reporting period to the next. If your time-to-fill definition changed three months ago from "requisition approval to offer acceptance" to "first candidate contact to start date," your before-and-after comparisons are meaningless. Data consistency is the foundation of credible benchmarking, and it requires discipline in how metrics are defined, collected, and reported.
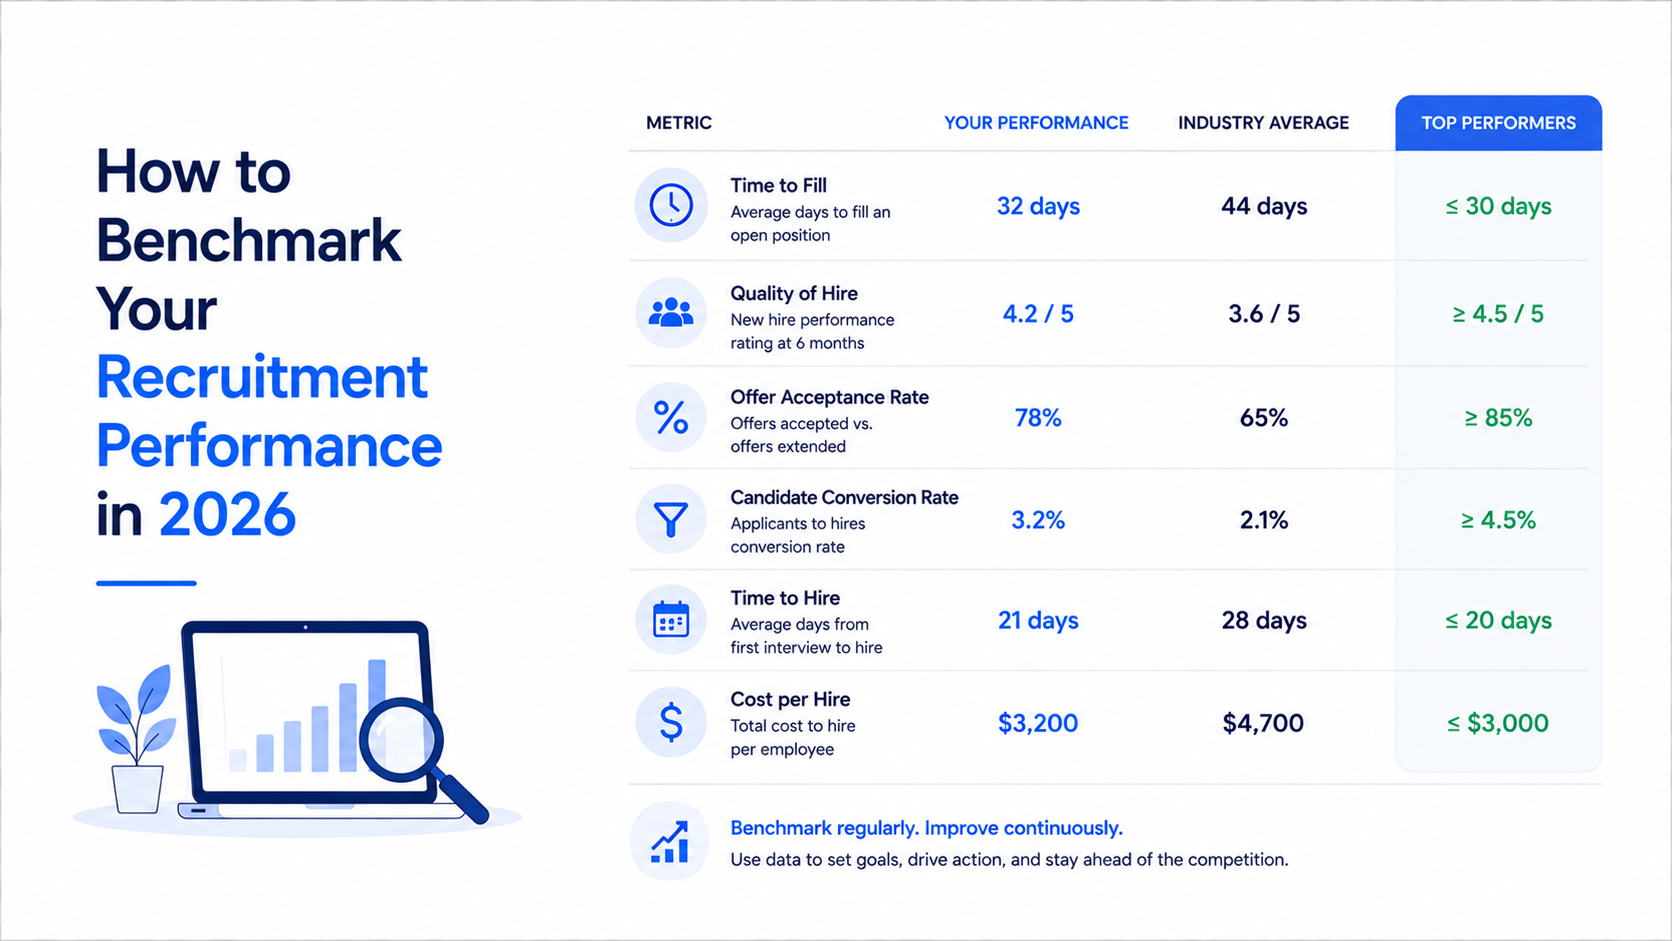
At minimum, you need accurate data on six core metrics before you can benchmark effectively: time-to-fill, time-to-hire, cost-per-hire, offer acceptance rate, quality of hire, and source-of-hire distribution. SHRM provides annual benchmarking surveys that cover these metrics segmented by industry, company size, and region, making it one of the most accessible external data sources for TA teams. However, to make use of external benchmarks, your internal data must be calculated using the same definitions. If SHRM defines time-to-fill as the number of days from requisition approval to offer acceptance and your team defines it differently, the comparison will be invalid. Aligning your internal definitions with the external benchmark's methodology is a prerequisite that many teams skip, and it is the most common reason benchmarking exercises produce misleading conclusions.
Beyond the core metrics, the quality of your data determines the depth of benchmarking you can perform. Teams that track metrics at the individual requisition level—with each requisition tagged by role type, seniority, geography, and sourcing channel—can benchmark at a far more granular and actionable level than teams that only track aggregate numbers. Deloitte workforce analytics research shows that organizations with requisition-level tagging achieve 40 to 60 percent more actionable insights from benchmarking exercises compared to those relying on aggregate data. The reason is simple: aggregate benchmarks tell you that your overall time-to-fill is above average. Requisition-level benchmarks tell you that your overall number is dragged down by three specific role types in two specific geographies, which is information you can actually act on. If your current data does not support this level of granularity, improving data quality should be your first investment before benchmarking.
Internal Benchmarking: Your Own Historical Baseline
Internal benchmarking—comparing your current performance against your own past performance—is the most accessible form of benchmarking and the one that should be established first. It requires no external data sources, no subscriptions to benchmarking services, and no complex statistical analysis. It simply requires tracking your key metrics consistently over time and reviewing the trends. The most valuable output of internal benchmarking is the trend line. A time-to-fill that has declined from 45 days to 38 days over six months is improving. A cost-per-hire that has increased from $4,000 to $6,000 over the same period needs investigation. These trends reveal whether your process changes, tool investments, and team decisions are producing the intended results.
LinkedIn talent acquisition reports consistently show that high-performing TA teams review their internal metrics on a monthly basis and conduct formal quarterly trend analyses. The monthly reviews catch sudden changes—a spike in offer declines, a drop in application completion rates—that require immediate attention. The quarterly analyses reveal slower-moving trends that are easy to miss in month-to-month noise but indicate systemic shifts in process performance. The combination of monthly operational reviews and quarterly strategic analysis creates a rhythm of continuous improvement that compounds over time.
The most powerful application of internal benchmarking is before-and-after analysis around specific changes. When you implement a new AI sourcing tool, shorten your application form, restructure your interview process, or launch a new employer branding campaign, internal benchmarking tells you whether the change worked. Compare the 90 days before the change to the 90 days after, controlling for role type, seasonality, and hiring volume. This controlled comparison isolates the impact of the change from the normal variation in your metrics and gives you evidence-based confidence that your investment produced a return. Teams that skip this step and simply assume their changes are working are often adding complexity without measuring impact, which leads to bloated tool stacks and uncertain ROI.
External Benchmarking: Industry and Peer Comparisons
External benchmarking is where the most strategic insights emerge, because it places your performance in the context of your competitive talent market. Knowing that your time-to-fill for software engineers is 42 days is useful internally. Knowing that the median for your industry and geography is 32 days changes the conversation entirely. It transforms time-to-fill from an operational metric into a competitive indicator, revealing that your competitors are hiring engineers 10 days faster—which means they are likely securing candidates you are losing. This kind of competitive intelligence is what elevates recruiting from an operational function to a strategic one.
The primary sources of external benchmarking data include industry associations, research firms, and specialized benchmarking platforms. SHRM publishes annual benchmarking reports covering cost-per-hire, time-to-fill, and quality-of-hire metrics segmented by industry, company size, and region. Gartner provides benchmarking data as part of its talent acquisition research subscription, with a focus on technology-enabled recruiting practices. McKinsey publishes periodic benchmarking studies on hiring process efficiency and quality-of-hire outcomes. Each of these sources has strengths and limitations, and the most rigorous TA teams draw from multiple sources rather than relying on a single one.
When using external benchmarks, the most important discipline is comparing against the right peer group. A technology company hiring in Silicon Valley should benchmark against other technology companies hiring in Silicon Valley—not against a national average that includes companies in lower-cost markets with different talent dynamics. EY talent benchmarking studies emphasize that geography is the single most important segmentation variable because compensation, candidate availability, and competitive intensity vary more by location than by industry. A company hiring data scientists in San Francisco faces a fundamentally different talent market than a company hiring the same role in Austin, and benchmarks that do not account for this difference will produce misleading conclusions.
Segmenting Benchmarks by Role, Level, and Geography
Aggregate benchmarks are starting points. Segmented benchmarks are where the actionable insights live. A company-wide time-to-fill of 40 days tells you very little about where to focus improvement efforts. But segmenting that number by role type—32 days for marketing, 45 days for engineering, and 58 days for data science—immediately reveals where the biggest opportunities and challenges exist. The same segmentation principle applies to every metric. Offer acceptance rate by seniority level reveals whether your executive hiring process is as competitive as your individual contributor process. Cost-per-hire by sourcing channel reveals where your recruiting budget is producing the best and worst returns. Source-of-hire quality by department reveals which business units benefit most from your current sourcing strategy.
Deloitte workforce analytics research recommends segmenting benchmarks along four dimensions: role family, seniority level, geography, and hiring urgency. Role family captures the fundamental differences in talent availability and evaluation complexity between functions like engineering, sales, finance, and operations. Seniority level accounts for the fact that entry-level, mid-level, and executive searches operate under completely different market dynamics. Geography captures the regional variation in talent supply, compensation, and competition. Hiring urgency distinguishes between planned, backfill, and critical roles that require different benchmarks and different expectations. When all four dimensions are applied, a single aggregate benchmark becomes dozens of specific, comparable reference points.
The practical challenge of segmented benchmarking is data volume. If you segment by 5 role families, 4 seniority levels, and 3 geographies, you have 60 segments. Some of those segments will have very few hires, making the data statistically unreliable. LinkedIn benchmarking best practices recommend a minimum of 20 to 30 data points per segment for reliable comparison. If a segment does not meet this threshold, it should be merged with a broader segment or excluded from the analysis. Presenting benchmarks based on five data points is worse than presenting no benchmark at all, because it creates a false sense of precision that can lead to incorrect decisions. The discipline of minimum data thresholds ensures that your segmented benchmarks are statistically meaningful.
Common Benchmarking Mistakes That Lead to Wrong Conclusions
The most dangerous benchmarking mistake is comparing against a peer group that is not actually comparable. This happens more often than most TA leaders realize, because the available benchmarking data is rarely a perfect match for any specific company. A mid-market technology company might find benchmarking data for "technology companies" that is dominated by large enterprises, or data for "mid-market companies" that is dominated by manufacturing firms. Neither peer group provides an accurate comparison. The solution is to use multiple data sources and triangulate—looking at your relative position across several benchmarks to build a composite picture rather than relying on a single data point.
The second common mistake is benchmarking against averages without understanding the distribution. Gartner warns that industry averages in recruiting metrics have very wide standard deviations. An average time-to-fill of 40 days might represent a range from 18 to 75 days across the peer group. A company at 42 days is technically above average but well within the normal range. A company at 70 days is a genuine outlier that needs attention. Without understanding the distribution, a TA leader might overreact to a number that is statistically normal or underreact to a number that represents a genuine performance problem. Always ask for ranges and percentiles, not just averages.
The third mistake—and perhaps the most damaging—is using benchmarks to justify the status quo rather than to drive improvement. When a TA leader discovers that their time-to-fill is at the industry median, the common reaction is relief. "We are average." But average is not the same as good. In a competitive talent market, being average means you are losing the best candidates to the companies that are above average. McKinsey research on competitive hiring dynamics shows that the companies consistently winning top talent operate in the top quartile of recruiting performance metrics. Benchmarking against the median tells you where the middle of the pack is. Benchmarking against the top quartile tells you what you need to aim for. The best practice is to use the median as a floor, not a ceiling, and to set improvement targets based on top-quartile performance.
Turning Benchmark Insights into Recruiting Strategy
Benchmarking data without strategy is trivia. The entire purpose of comparing your metrics against external references is to identify specific, actionable improvements that will move your performance in the right direction. The most effective approach is a three-step process. First, identify the metrics where you have the largest gap between your current performance and the benchmark target. Second, diagnose the root cause of each gap using your internal process data. Third, design and implement a targeted intervention to close the gap, and measure the results after one full hiring cycle.
EY talent management case studies illustrate how this process works in practice. A technology company discovered through benchmarking that its offer acceptance rate for senior engineers was 68 percent, compared to an industry top-quartile benchmark of 85 percent. The root cause diagnosis revealed two factors: the company was taking an average of six business days to deliver offers after the final interview, and its compensation ranges were calibrated against data that was 18 months old. The intervention was straightforward: pre-approved compensation bands updated with current market data, and a process redesign that delivered verbal offers within 24 hours. Within two quarters, the offer acceptance rate climbed to 82 percent, and the company estimated it had saved over $400,000 in re-sourcing costs for roles where the original offer had been declined.
The strategic value of benchmarking compounds over time. The first benchmarking exercise typically reveals the largest gaps and produces the most impactful improvements. Subsequent exercises refine the picture, catching new gaps as they emerge and validating that previous interventions are holding. Over twelve months of quarterly benchmarking, a TA team can build a comprehensive understanding of its competitive position across every dimension of recruiting performance. This understanding transforms the team's ability to make the case for investment, whether in new AI recruiting technology, additional headcount, process redesign, or employer branding. When you can show your CEO that your time-to-fill for engineering roles is 15 days above the industry top quartile and that closing that gap would produce an estimated $1.2 million in productivity savings, the conversation about resources changes from a request to a business case.
Building a Benchmarking Practice That Improves Over Time
Benchmarking is not a one-time project. It is an ongoing practice that becomes more valuable as it accumulates data and context. The first benchmarking exercise is the hardest because it requires building the data infrastructure, establishing definitions, finding reliable external sources, and training the team to interpret the results. Each subsequent exercise is easier and more insightful because the foundation has been laid and the team has developed the analytical muscle to extract meaning from the numbers.
SHRM recommends establishing a formal quarterly benchmarking cadence with a standardized report format. The report should include the current value of each benchmarked metric, the trend over the past four quarters, the external benchmark for comparison, and the gap between current performance and the target. This standardized format allows the TA leader to quickly assess performance across all dimensions and identify where attention is needed. The report should be shared with the broader TA team and with key business stakeholders, creating transparency and shared accountability for improvement.
The most advanced TA teams are building real-time benchmarking capabilities that compare their live recruiting metrics against external benchmarks on an ongoing basis, rather than relying on quarterly snapshots. Agentic AI platforms are making this possible by continuously analyzing pipeline data, comparing it against embedded benchmark datasets, and alerting the team when a metric deviates beyond an acceptable range. This real-time approach catches performance problems weeks earlier than quarterly reviews, giving the team time to intervene before the problem manifests as missed hiring targets. As benchmarking data becomes more accessible and AI tools make real-time comparison possible, the competitive advantage will shift decisively toward the TA teams that have invested in building this capability. The teams that establish a rigorous benchmarking practice today will be the ones setting the benchmarks that others chase tomorrow.