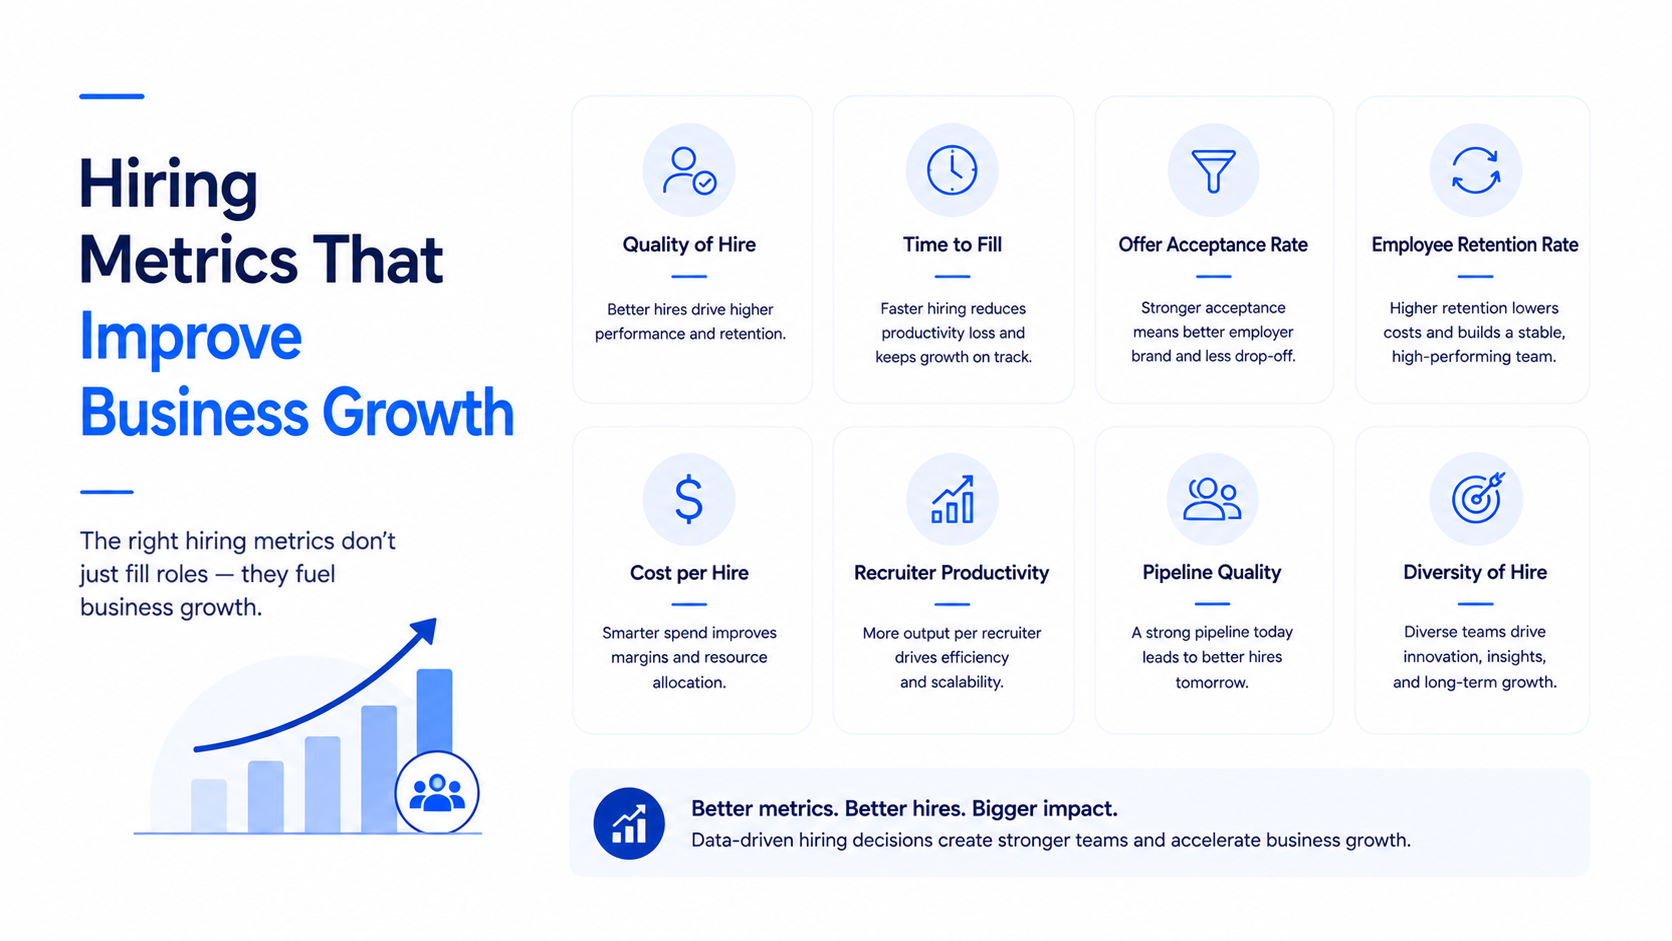
The difference is not organizational structure. It is the metrics they track. When a recruiting team measures time-to-fill and cost-per-hire, they speak the language of efficiency. When they measure time-to-productivity, revenue impact, and retention value, they speak the language of growth. And growth is the only language that gets a seat at the leadership table.
The shift from operational metrics to business metrics is not a rebrand. It is a fundamentally different way of thinking about what hiring does for the organization. Efficiency metrics ask: how fast and cheap can we fill roles? Business metrics ask: how much value does each hire create, and how does the hiring process itself accelerate or slow that value creation?
The Gap Between What Recruiters Measure and What CEOs Care About
According to Greenhouse's 2026 Hiring Benchmarks Report, applications per recruiter have surged 411% since 2022 while recruiter headcount has dropped 56%. Recruiters are managing five times as many applications with half as many people. Yet the metrics most teams report have not changed in a decade.
The typical recruiting dashboard shows:
Time-to-fill
Cost-per-hire
Number of open requisitions
Offers extended and accepted
Source of hire breakdown
These numbers are useful for managing the recruiting function. They are useless for connecting recruiting to business outcomes. A CEO does not care that you filled a role in 42 days at a cost of $4,500. A CEO cares whether that hire generated revenue, reduced risk, or enabled a strategic initiative.
The gap is widening. According to Metaview's 2026 recruiting benchmarks, only 40% of talent acquisition professionals consider quality of hire their most valuable KPI. The majority still prioritize speed and cost. But quality of hire is the metric that connects recruiting to business performance. Without it, recruiting is a cost center. With it, recruiting is a growth engine.
The Business Metrics That Actually Matter
The metrics that improve business growth share one characteristic: they measure outcomes, not activity. They answer the question what did this hire enable? rather than how efficiently did we process this hire?
Time-to-Productivity
Time-to-productivity measures how long it takes a new hire to reach full performance in their role. This is not the same as time-to-hire, which measures the recruiting process. Time-to-productivity measures the business impact of that process.
The benchmark varies by role complexity. According to PageUp People's global benchmark data, individual contributors typically reach full productivity in 3 to 6 months. Managers take 6 to 12 months. Senior leaders may take 12 to 18 months. Every week shaved off this timeline is a week of additional value creation.
The recruiting function influences time-to-productivity through three levers: candidate quality at the point of hire, onboarding design, and role clarity. A candidate who was screened for actual capability — not just resume fit — will ramp faster. A candidate who understands the role before accepting will have clearer expectations. A candidate who was sourced for cultural alignment will integrate faster with the team.
Recruiting teams that track time-to-productivity can demonstrate direct business impact. If a sales hire reaches full quota 30 days faster, that is 30 days of additional revenue. If an engineer ships their first feature 2 weeks earlier, that is 2 weeks of accelerated product development. These are numbers the CFO understands.
Quality of Hire
Quality of hire is the single most important business metric in recruiting. It measures whether the people you hired are actually performing well. And it is the metric most teams struggle to define.
According to Testlify's 2026 recruitment KPIs guide, a LinkedIn survey found that quality of hire is considered the single most valuable KPI by 40% of talent acquisition professionals. Yet fewer than a third of organizations have a consistent, documented method for measuring it.
The most effective models combine weighted signals: performance rating at 90 days and 6 months (35 to 40%), 12-month retention (25 to 30%), hiring manager satisfaction score (15 to 20%), speed to full productivity (10 to 15%), and peer cultural fit rating (5 to 10%).
The business case is clear. The U.S. Department of Labor estimates that a bad hire costs up to 30% of first-year earnings. SHRM puts the figure at 50 to 60% for mid-level roles and 200% or more for senior leadership. A hire who exceeds expectations generates multiples of their salary in value. A hire who underperforms destroys value through lost opportunity, team disruption, and replacement costs.
Tracking quality of hire transforms recruiting from a cost center into a value creator. When a recruiting team can show that their hires outperform the market average on performance ratings, retention, and speed-to-productivity, they have proven their strategic worth. When they can show that hires from certain sources or screened through certain methods perform better, they have actionable intelligence to improve the process.
Revenue Per Employee
Revenue per employee is a company-wide metric, but recruiting can directly influence it. This metric measures total revenue divided by total headcount. It reflects how efficiently the organization converts talent into revenue.
High-growth companies obsess over this number. A company with $500,000 revenue per employee is more efficient than one with $300,000, even if the latter has more people. Recruiting influences revenue per employee through two channels: the quality of hires and the speed at which they reach productivity.
A sales team that hires faster and ramps faster generates more revenue per head. An engineering team that hires stronger technical talent ships more features per sprint. A customer success team that hires people with the right problem-solving skills reduces churn and increases expansion revenue. All of these paths lead back to recruiting decisions.
The best recruiting teams track revenue per employee by function and by hire cohort. They can show that hires from Q1 2026 generated 15% more revenue per head than hires from Q1 2025. That is a growth story the board wants to hear.
Retention Value
Retention is not just an HR metric. It is a business metric with direct financial impact. According to Pin's 2026 recruitment funnel benchmarks, the cost of replacing an employee ranges from 50% of salary for entry-level roles to 200% for senior leadership. This includes direct costs like recruiting and training, and indirect costs like lost productivity, team disruption, and institutional knowledge loss.
But retention value goes beyond cost avoidance. Long-tenure employees accumulate customer relationships, product knowledge, and process expertise that compound over time. A sales rep who stays for 5 years builds a book of business that generates recurring revenue. An engineer who stays for 4 years understands the codebase deeply enough to ship features 3x faster than a new hire.
Recruiting influences retention before the employee starts. Candidates who are screened for cultural alignment, role fit, and long-term career trajectory are more likely to stay. Candidates who are sold an accurate picture of the role — not an inflated one — have clearer expectations and lower early attrition. Candidates who are sourced from networks where they already have relationships — employee referrals, industry communities — have higher social capital and stronger reasons to stay.
Tracking retention by source, by screening method, and by recruiter gives the recruiting team actionable intelligence. If referrals have a 2-year retention rate 40% higher than job board hires, that justifies increased investment in referral programs. If candidates screened through conversational AI have higher 12-month retention than those screened through resume review, that validates the screening method.
Hiring Manager Satisfaction
Hiring manager satisfaction is a leading indicator of business impact. According to Metaview's benchmarks, the healthy target is NPS 30-plus or 4.0-plus on a 5-point scale. Low scores predict downstream pain: hiring managers stop using the TA team, start sourcing their own candidates, and push for expensive agency spend.
But the metric matters beyond internal politics. Hiring managers are the people who convert hires into business value. If they are dissatisfied with the recruiting process, they are less likely to invest time in onboarding, coaching, and development. They are more likely to view new hires as problems to be managed rather than assets to be leveraged.
High hiring manager satisfaction correlates with faster time-to-productivity, higher quality of hire, and better retention. The recruiting team that delivers candidates who meet or exceed expectations builds trust. The team that misses repeatedly loses influence and budget.
The best way to measure this is not an annual survey. It is continuous feedback at key milestones: 30 days post-hire (did the candidate meet expectations?), 90 days (is the candidate ramping effectively?), and 6 months (would you hire this person again?). This creates a real-time quality signal that the recruiting team can act on immediately.
Connecting the Metrics to Business Outcomes
Individual metrics are interesting. Connected metrics are powerful. The best recruiting analytics frameworks show how hiring decisions cascade into business results.
Consider this causal chain:
A recruiting team invests in AI-powered sourcing and conversational screening. Response rates increase from 15% to 40%. The quality of candidates entering the pipeline improves because semantic matching finds people with actual capability, not just keyword matches. Time-to-hire drops from 45 days to 32 days because the pipeline is fuller and screening is faster.
The candidates who enter are better fits. Time-to-productivity drops from 4 months to 2.5 months. Hiring manager satisfaction rises from NPS 15 to NPS 42. Quality of hire scores improve — 85% of new hires meet or exceed expectations at 6 months, up from 65%.
Retention improves. 12-month retention rises from 75% to 88%. The cost of turnover drops. The revenue generated per new hire increases because people ramp faster, perform better, and stay longer.
The recruiting team can now show a direct line from their process changes to business outcomes: faster hiring, better performance, lower turnover, higher revenue per employee. That is not an HR report. That is a business case.
The Metrics That CEOs and CFOs Actually Want to See
If you are presenting recruiting metrics to the C-suite, lead with outcomes, not process. Here is what they care about:
Revenue impact: How much revenue did new hires generate in their first year?
Cost of bad hires: What did underperforming hires cost in lost productivity and replacement?
Time-to-value: How long until new hires contribute at full capacity?
Retention ROI: What is the return on investment for retention-focused hiring practices?
Competitive positioning: Are we hiring faster and better than our competitors?
These are not metrics that most ATS systems generate automatically. They require integration between recruiting data, HRIS data, and business performance data. They require the recruiting team to partner with finance, operations, and business unit leaders. And they require a shift in mindset from reporting activity to measuring impact.
How to Build a Business-Focused Recruiting Dashboard
The dashboard that drives business growth looks different from the dashboard that manages recruiting operations. Here is how to build one.
Start with the Outcome Metrics
Place quality of hire, time-to-productivity, and retention value at the top. These are the metrics that connect recruiting to business performance. Make them visible, track them monthly, and set improvement targets.
Layer in the Process Metrics
Below the outcome metrics, show the process metrics that influence them: time-to-hire, response rate, source effectiveness, and screening accuracy. These tell you why the outcomes are what they are. If quality of hire drops, the process metrics show where the leak is.
Add the Leading Indicators
At the bottom, show the metrics that predict future outcomes: pipeline health, candidate experience scores, and hiring manager satisfaction trends. These are early warning signals. A drop in candidate experience today predicts a drop in offer acceptance next quarter. A decline in hiring manager satisfaction predicts a decline in quality of hire six months from now.
Make It Actionable
Every metric should have an owner, a target, and a trigger. Response rate below 30% triggers a channel mix review. Time-to-hire above 45 days triggers a scheduling audit. Quality of hire below 70% triggers a screening method review. The dashboard is not a report. It is a decision tool.
The Bottom Line
Recruiting teams that want to improve business growth must stop measuring what they do and start measuring what they enable. Time-to-fill and cost-per-hire are necessary operational metrics, but they are not sufficient. The metrics that matter are the ones that connect hiring to revenue, productivity, and competitive advantage.
Time-to-productivity measures how fast hires create value. Quality of hire measures how much value they create. Revenue per employee measures how efficiently the organization converts talent into growth. Retention value measures how that value compounds over time. Hiring manager satisfaction measures whether the people who convert hires into business outcomes trust the process.
The teams that track these metrics, connect them to decisions, and present them in the language of business do not just fill roles. They build the talent engine that drives growth. And that is the only metric that ultimately matters.