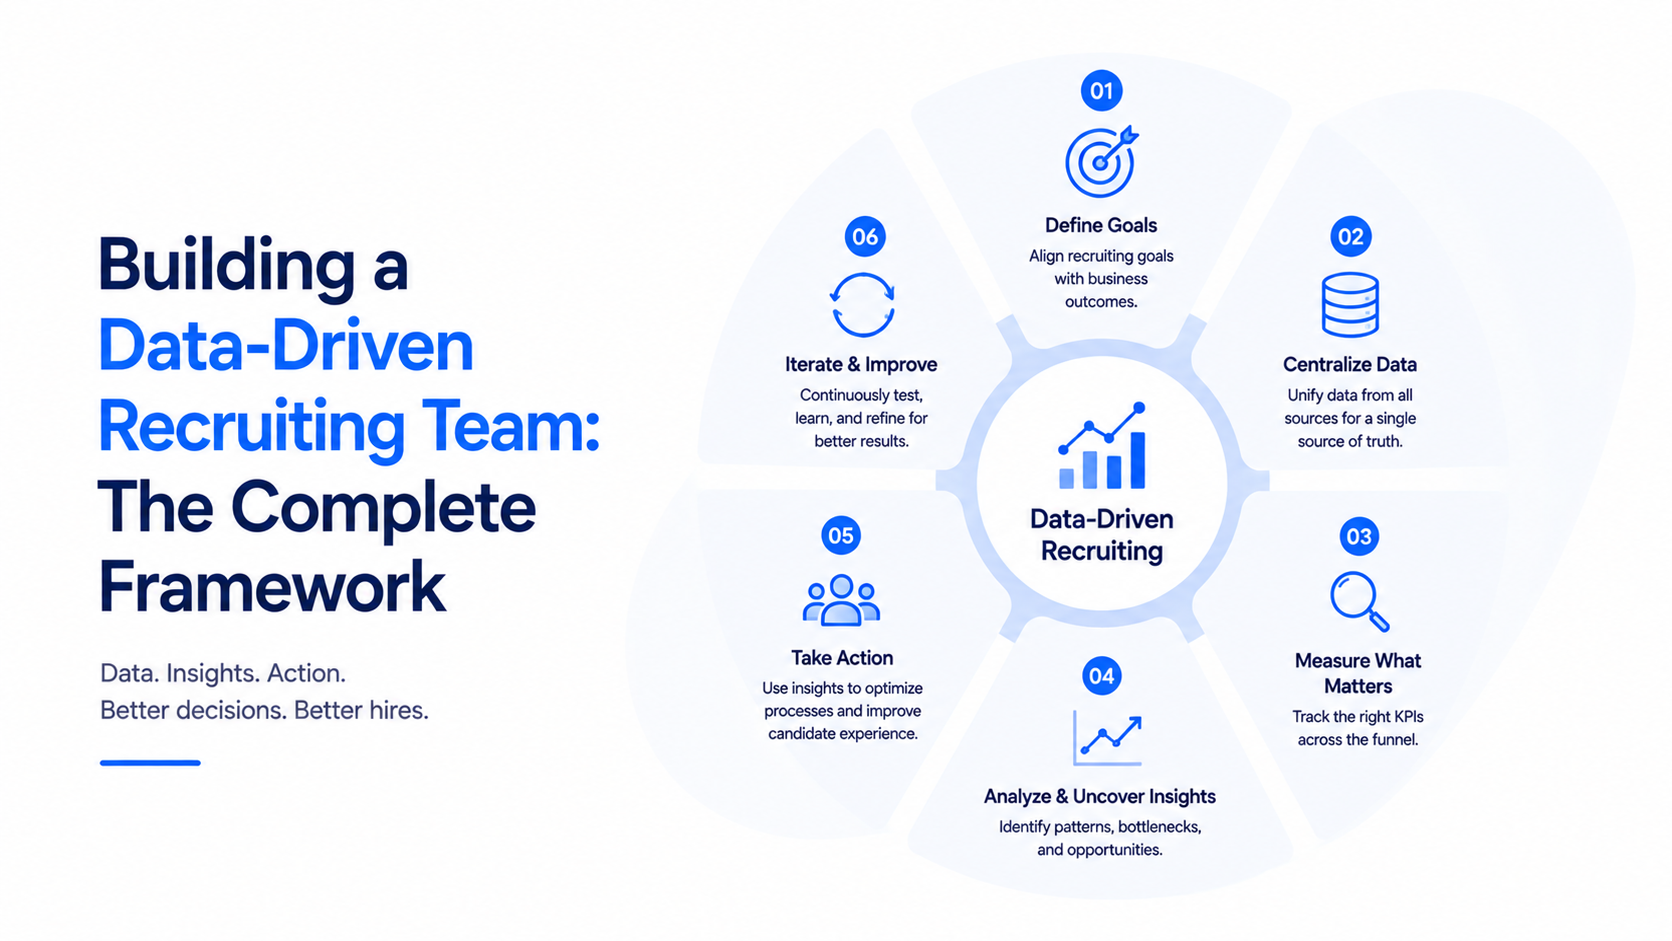
The phrase "data-driven recruiting" has become so ubiquitous in talent acquisition that it has lost almost all meaning. Attend any recruiting conference, browse any TA vendor website, or read any LinkedIn post about hiring strategy, and you will encounter the term within the first three sentences. But when you look past the language and examine what most TA teams actually do with their data, the gap between rhetoric and reality is enormous. A dashboard that displays time-to-fill and requisition count is not data-driven recruiting. A monthly report that shows hiring volume versus target is not data-driven recruiting. These are reporting activities, and reporting is the most basic level of data use. A truly data-driven recruiting team is one where every significant decision—from which sourcing channels to invest in, to how to structure the interview process, to which recruiters to deploy on the most critical searches—is informed by evidence rather than intuition, precedent, or the loudest opinion in the room. Building that kind of team is not a technology project. It is a capability-building exercise that requires changes in skills, culture, process, and leadership. This post provides the framework for making that transition.
What "Data-Driven" Actually Means in Recruiting
A data-driven recruiting team operates on a simple principle: when a decision needs to be made, the first question asked is "What does the data tell us?" rather than "What do we think?" This does not mean that every decision is reduced to a mathematical formula or that human judgment is eliminated. It means that judgment is informed by evidence and applied with awareness of what the numbers reveal. A hiring manager who wants to add three more interview rounds because they "want to be really sure" is making an intuition-based request. A TA leader who responds with "Our data shows that adding interview rounds beyond four reduces our offer acceptance rate by 12 percent with no improvement in quality of hire" is making a data-driven counterargument. The decision might still go either way, but it is being made with full awareness of the trade-offs.
McKinsey research on data-driven organizations distinguishes between four levels of analytical maturity. The first level is descriptive analytics—reporting on what happened. The second is diagnostic analytics—understanding why it happened. The third is predictive analytics—forecasting what will happen. The fourth is prescriptive analytics—recommending what should be done. The vast majority of TA teams operate entirely at the first level. They can tell you how many hires they made last quarter, what the average time-to-fill was, and how much they spent. Very few can diagnose why their quality of hire declined, predict which requisitions will be hardest to fill, or prescribe the optimal sourcing strategy for a specific role type. Moving up this maturity curve is what building a data-driven team actually means.
Gartner estimates that fewer than 15 percent of TA organizations have reached the predictive or prescriptive stages of analytical maturity. The primary barrier is not technology—most teams have access to sufficient data and tools. The primary barrier is that the team has never been trained to think analytically, the processes have never been designed to capture the data needed for advanced analysis, and the leadership has never demanded evidence-based decision-making as a standard practice. Technology can accelerate the transition, but it cannot replace the foundational work of building analytical capability into the team's DNA.
The Data Foundation Every TA Team Needs First
Before a TA team can do anything sophisticated with data, it needs a clean, consistent, and complete data foundation. This is the least glamorous part of building a data-driven team, and it is the part that most teams skip or underinvest in. The foundation consists of three elements: consistent metric definitions, complete data capture, and a single source of truth for recruiting data. Consistent metric definitions mean that every recruiter in the organization calculates time-to-fill, quality of hire, and every other metric using the same formula. If one recruiter measures time-to-fill from requisition approval and another measures it from first candidate contact, the aggregate data is meaningless. SHRM benchmarking guidelines provide standardized definitions for the most common recruiting metrics, and adopting these standards is the logical starting point for any team that wants to build credible analytics.
Complete data capture means that every recruiting event—from the first candidate touchpoint to the final hire or rejection—is recorded in a structured, queryable format. This includes not just the outcomes but the process data: which channel sourced the candidate, how many outreach messages were sent before a response, how many days elapsed between each pipeline stage, which interviewers participated, and what scores they assigned. This process-level data is what enables the diagnostic and predictive analytics that differentiate a data-driven team from a reporting team. Deloitte workforce analytics research shows that teams with complete process-level data are 3.5 times more likely to identify the root cause of hiring problems compared to teams that only track outcome data.
A single source of truth means that all recruiting data lives in one place—or at least in one logically connected data layer—rather than being scattered across spreadsheets, email, the ATS, the HRIS, and multiple point solutions. The most common reason TA teams fail to become data-driven is that their data is fragmented across too many systems, making it impossible to perform the cross-referencing and trend analysis that advanced analytics requires. Building this unified data layer does not necessarily mean replacing your ATS. It means ensuring that data from all your recruiting systems can be extracted, combined, and analyzed in a single environment—whether that is a data warehouse, a business intelligence platform, or a dedicated recruiting analytics tool. Investing in this data foundation before investing in sophisticated analytics tools is the most important sequencing decision a TA leader can make.
Hiring and Developing Analytically Minded Recruiters
Technology and data infrastructure are necessary but insufficient for building a data-driven team. The people who operate the process must have the skills and mindset to use data effectively. This does not mean every recruiter needs to be a data scientist. It means every recruiter needs to be comfortable interpreting basic metrics, identifying patterns and anomalies in data, and using evidence to support their recommendations to hiring managers. The most practical approach is to assess analytical aptitude during the hiring process and then develop those skills through ongoing training and coaching.
During hiring, the most predictive indicator of analytical capability is not technical skill but intellectual curiosity. Recruiters who naturally ask "Why did that happen?" and "How does this compare to last month?" are the ones who will thrive in a data-driven environment. LinkedIn talent research shows that the top-performing recruiters in data-driven TA teams share three behavioral traits: they reference specific data points in their candidate presentations rather than relying on general impressions, they proactively identify trends in their pipeline metrics without being asked, and they push back on hiring manager requests with evidence when the data does not support the request. These behaviors can be assessed during the interview process by presenting candidates with a data scenario and observing how they interpret and respond to it.
Once recruiters are on board, skill development should follow a structured curriculum that progresses from data literacy to data application. EY people analytics research recommends three tiers of training. The first tier covers data literacy: understanding metric definitions, reading dashboards accurately, and identifying basic trends. The second tier covers diagnostic analysis: using data to answer "why" questions, correlating metrics to identify root causes, and segmenting data to reveal patterns. The third tier covers strategic application: using data to build business cases, present evidence-based recommendations to executives, and design experiments that test hiring hypotheses. This training should not be a one-time workshop. It should be an ongoing program that is reinforced through coaching, team discussions, and performance expectations that reward analytical thinking.
The Metrics Framework That Drives the Right Behavior
A data-driven team needs a metrics framework that is aligned with its strategic objectives and designed to encourage the behaviors that produce the best outcomes. The most common mistake TA leaders make is measuring too many things, which dilutes focus and creates confusion about what actually matters. Gartner recommends that TA teams operate with a core set of six to eight metrics that are reviewed regularly, with additional diagnostic metrics available for deeper analysis when needed. The core metrics should cover four categories: efficiency, quality, experience, and strategic impact.
Efficiency metrics include time-to-fill, time-to-hire, and cost-per-hire. These are necessary operational indicators, but they should not dominate the framework. Quality metrics include quality-of-hire, first-year retention, and hiring manager satisfaction. These are the metrics that connect recruiting to business outcomes and should carry the most weight in the framework. Experience metrics include candidate satisfaction, offer acceptance rate, and candidate Net Promoter Score. These capture the effectiveness of the process from the candidate's perspective and are leading indicators of employer brand strength. Strategic impact metrics include diversity of hire, source quality, and revenue-per-employee for new hires. These capture the long-term value the recruiting function is creating for the organization.
The most critical element of the metrics framework is how it is used. McKinsey organizational performance research consistently shows that the impact of metrics is determined not by which metrics are chosen but by how the performance conversation is conducted around them. A metrics framework used for coaching and development drives improvement and engagement. The same framework used for ranking and punishment drives gaming, risk aversion, and attrition. Building a data-driven team requires creating a culture where metrics are tools for learning and improvement, not instruments of surveillance and judgment. This distinction is the difference between a team that uses data to get better and a team that uses data to look good.
Building the Right Technology Stack for Recruiting Analytics
The technology stack for a data-driven recruiting team serves three functions: data collection, data analysis, and data activation. Data collection tools—including the ATS, CRM, sourcing platforms, and assessment tools—capture the raw material. Data analysis tools—including business intelligence platforms, dedicated recruiting analytics solutions, and spreadsheet-based analysis—transform the raw data into insights. Data activation tools—including automated workflows, AI-powered recommendations, and real-time dashboards—turn insights into actions. The most effective stacks have clean integration between all three layers, ensuring that data flows seamlessly from collection to analysis to action without manual intervention.
Deloitte technology selection research for TA emphasizes that the analytics capability of the stack should be evaluated independently from the operational capabilities. An ATS might excel at managing the hiring workflow but provide weak analytics. A sourcing tool might generate strong candidates but produce no usable data about sourcing effectiveness. When evaluating tools, the question should not just be "Does this tool do its primary job well?" but also "Does this tool produce data that integrates with our analytics platform and contributes to our ability to make evidence-based decisions?" Teams that ask this second question consistently build stacks that support data-driven decision-making, while teams that do not end up with a collection of tools that operate in isolation and produce disconnected data.
The emergence of agentic AI platforms is rapidly changing what is possible in recruiting analytics. These platforms do not just report data—they analyze patterns, generate predictions, and recommend actions autonomously. A recruiter using a traditional analytics tool might see a dashboard showing that their pipeline coverage has dropped 30 percent over the past month. A recruiter using an agentic AI platform might receive a proactive alert that their pipeline coverage is declining, along with a recommended action plan that identifies the specific role types where coverage is weakest, suggests which sourcing channels to prioritize, and predicts the impact on hiring targets if the trend continues. This shift from passive reporting to active intelligence is what moves a TA team from the descriptive stage to the predictive and prescriptive stages of analytical maturity. When evaluating these platforms, the key question is whether the AI provides actionable recommendations or just data visualizations.
Creating a Data Culture in Your TA Team
Data culture is the set of behaviors, expectations, and norms that determine how a team interacts with information. In a data-rich but data-poor team, reports are generated but never discussed. Dashboards are built but rarely consulted. Metrics are collected but not used to make decisions. In a genuinely data-driven team, data is the default reference point in every significant conversation. When a recruiter presents a shortlist to a hiring manager, the presentation includes data on how each candidate was sourced, how they scored on assessments, and how their profile compares to successful hires in similar roles. When a TA leader proposes a budget reallocation, the proposal is supported by data on channel ROI and source quality. When a hiring manager challenges a process change, the response includes evidence from before-and-after analysis.
SHRM research on organizational culture change identifies three levers for building a data culture: leadership modeling, structured data rituals, and performance expectations. Leadership modeling means that the TA leader consistently references data in their own decision-making, asks data-driven questions in team meetings, and visibly uses evidence to support their recommendations to executives. Structured data rituals mean that the team has regular, recurring forums where data is reviewed and discussed—weekly pipeline reviews, monthly metric deep-dives, and quarterly strategy sessions that are grounded in data analysis. Performance expectations mean that analytical thinking is explicitly included in recruiter performance criteria and coaching conversations.
The most powerful lever is leadership modeling. When the TA leader walks into a meeting and the first thing they do is pull up the dashboard and ask "What is the data telling us about this issue?", they are establishing the cultural norm. When they respond to a hiring manager's opinion-based assertion with "Let me pull the numbers on that and we can discuss what they mean," they are teaching the team that evidence takes precedence over authority. LinkedIn organizational research confirms that culture change in functional teams is driven primarily by the behavior of the team leader, not by training programs, tool investments, or policy changes. The single most impactful action a TA leader can take to build a data-driven team is to personally demonstrate the behaviors they want to see in their team, consistently and visibly, in every interaction.
From Reporting to Prediction: The Maturity Curve
The journey from a reporting team to a predictive team follows a recognizable maturity curve with four stages. The first stage is reporting, where the team can describe what happened—how many hires, how long it took, how much it cost. Most TA teams operate at this stage. The second stage is diagnostics, where the team can explain why things happened—why time-to-fill increased for engineering roles, why offer acceptance rate declined, why source quality shifted. This requires cross-referencing metrics, segmenting data, and conducting root cause analysis. The third stage is prediction, where the team can forecast future outcomes—predicting which requisitions will be hardest to fill, which candidates are most likely to accept offers, and which sourcing investments will produce the highest return. The fourth stage is prescription, where the team can recommend specific actions—suggesting the optimal sourcing strategy for a new role type, recommending process changes to improve a specific metric, or proposing budget reallocations based on predicted ROI.
McKinsey analytics maturity research shows that most organizations spend two to three years moving from the reporting stage to the diagnostic stage, and another two to three years reaching the predictive stage. The key accelerant is not technology investment—it is the discipline of asking diagnostic questions at every review. When the team reports that time-to-fill increased, the leader's response should be "Why?" When the team identifies the root cause, the follow-up should be "What are we going to do about it, and how will we measure whether it worked?" This iterative questioning pattern, applied consistently over months and quarters, gradually builds the team's analytical muscle and moves them up the maturity curve.
Gartner advises TA leaders to set explicit maturity targets and track progress against them. A practical target for most teams is to reach the diagnostic stage within 12 months and the predictive stage within 24 months. This requires investing in data quality, analyst capabilities, and the cross-functional relationships needed to access post-hire performance data. Understanding the difference between AI sourcing and AI recruiting becomes important at the predictive stage, because the data generated by these tools—candidate engagement patterns, assessment scores, sourcing channel attribution—is what feeds predictive models. Teams that reach the predictive stage gain a significant competitive advantage: they can anticipate problems before they materialize and allocate resources proactively rather than reactively. That is the ultimate payoff of building a data-driven recruiting team, and it is achievable for any TA organization willing to invest in the fundamentals.
Common Pitfalls That Derail Data-Driven Recruiting
The most common pitfall is measuring everything and analyzing nothing. TA teams that deploy comprehensive dashboards with dozens of metrics often find that the sheer volume of data is paralyzing rather than empowering. When every metric is treated as equally important, none of them are important. The antidote is ruthless prioritization: identify the six to eight metrics that matter most, make them the core of your reporting and review cadence, and relegate everything else to a secondary analysis layer that is accessed only when a specific question needs answering.
The second pitfall is analysis paralysis—the belief that every decision must wait for perfect data. Data-driven does not mean data-perfect. In a fast-moving hiring environment, waiting for comprehensive analysis before taking action is often more costly than making a decision based on incomplete data and course-correcting as new information becomes available. EY decision science research recommends adopting a "70 percent confidence" standard: if you have enough data to be 70 percent confident in the direction of the decision, proceed and refine as you go. This approach maintains the forward momentum that recruiting requires while still grounding decisions in evidence.
The third pitfall is using data to confirm what you already believe rather than to discover what is actually true. This confirmation bias is subtle and pervasive. A TA leader who believes job boards are the best sourcing channel will find data points that support that belief and ignore data points that contradict it. A hiring manager who believes long interview processes produce better hires will focus on the one time a longer process caught a bad fit and ignore the twenty times it caused a good candidate to withdraw. Building a genuinely data-driven team requires creating a culture where data is used to challenge assumptions, not reinforce them. The most effective practice is to appoint a formal devil's advocate in strategic discussions—someone whose role is to ask "What if the data is telling us something different from what we expect?" This simple practice, applied consistently, is one of the most powerful safeguards against confirmation bias and one of the clearest markers of a team that is truly data-driven rather than merely data-informed.