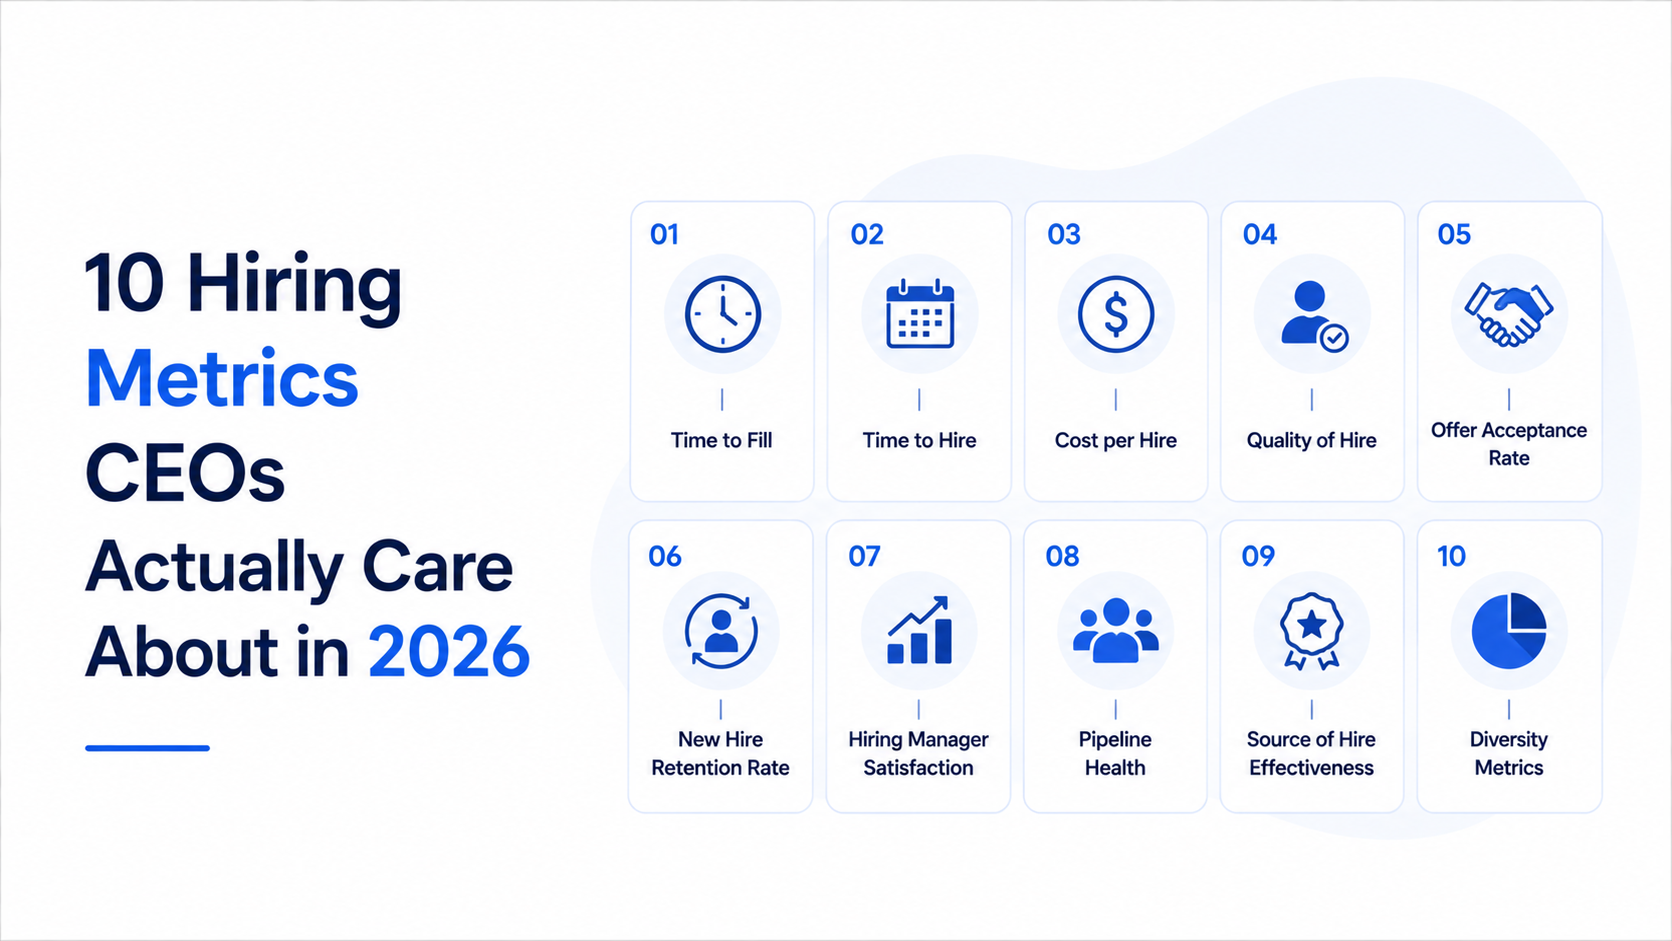
What happens when your CEO walks into a talent review meeting and asks a single question: "So, is our hiring actually working?" If your first instinct is to pull up time-to-fill reports and source-of-hire breakdowns, you are already losing the room. That is not because your data is wrong. It is because the language of recruiting operates in an entirely different currency than the language of the C-suite. Recruiters measure activity. CEOs measure impact. Recruiters track process efficiency. CEOs track business outcomes. The disconnect is not just frustrating—it is expensive. When TA teams cannot translate their work into terms that resonate with executive leadership, budgets shrink, headcount requests get denied, and recruiting gets treated as a cost center rather than a strategic function. The good news is that the gap between what recruiters report and what CEOs need is not as wide as it seems. It simply requires a different lens on the same data. In this post, we break down the ten hiring metrics that actually matter to CEOs—what they measure, why executives care, and how to present them in a way that turns recruiting from an operational function into a boardroom priority.
Why CEOs Judge Hiring by Different Rules
CEOs operate under a fundamentally different set of pressures than recruiting professionals. Their evaluation of hiring performance is not about how fast a requisition gets filled or how many candidates entered the pipeline. It is about whether the people being hired are driving revenue, reducing risk, and building competitive advantage. According to McKinsey, companies that align their talent strategies with business outcomes outperform their peers by up to 20 percent in profitability. This means the moment a CEO looks at a recruiting dashboard, they are not searching for operational metrics—they are searching for evidence that hiring is contributing to the company's strategic goals.
The typical TA dashboard is designed to help recruiters optimize their daily work. It tracks pipeline stages, interview-to-offer ratios, and candidate experience scores. These are valuable metrics for managing a recruiting process, but they do not answer the questions a CEO cares about. A CEO wants to know: Are we hiring the right people? Are we spending efficiently? Is our talent acquisition function giving us an edge over competitors? The disconnect between these two perspectives is one of the primary reasons recruiting teams struggle to secure executive-level investment. When the metrics being reported do not connect to business outcomes, the function appears operational rather than strategic.
Bridging this gap does not require abandoning the metrics recruiters rely on. It requires supplementing them with a set of executive-aligned indicators that translate recruiting activity into business impact. Gartner research shows that high-performing TA teams present no more than eight to twelve key metrics to their executive stakeholders—each one directly tied to a business outcome. The ten metrics covered in this post are selected specifically because they pass the CEO test: they are easy to understand, directly connected to business value, and actionable at the executive level. By restructuring your reporting around these indicators, you shift the conversation from "how recruiting is doing" to "how hiring is driving the business."
Cost per Hire and Total Recruiting Spend
Cost per hire is one of the few recruiting metrics that already has a natural home in the CEO's vocabulary. Every executive understands cost, and when you can present hiring costs in relation to the value those hires create, the conversation changes entirely. The standard formula divides total recruiting costs—including agency fees, job board spend, recruiter salaries, and technology costs—by the number of hires made in a given period. But the version that resonates with CEOs goes a step further: it compares cost per hire against the revenue generated by new hires in their first year. SHRM provides benchmarking data that allows companies to compare their hiring costs against industry averages, giving executives the context they need to evaluate whether the recruiting function is spending efficiently.
Total recruiting spend is the broader companion metric that gives CEOs a panoramic view of the investment going into talent acquisition. While cost per hire normalizes the number, total spend reveals the scale of the investment and how it changes over time. A CEO who sees that recruiting costs have increased by 30 percent year over year will naturally ask whether that investment is yielding proportional returns. If you can show that the same period saw a 25 percent improvement in quality of hire or a 40 percent reduction in early turnover, the conversation shifts from cost containment to strategic investment. The key is presenting these numbers together, not in isolation, so the executive sees the full picture of investment and return.
One of the most compelling ways to present hiring cost data is by breaking it down by channel and role type. Not all hires cost the same, and CEOs know this intuitively. Enterprise sales hires sourced through executive search firms carry a different cost profile than junior roles filled through campus recruiting. By showing cost per hire segmented by channel—internal recruiting, agencies, job boards, referrals, and AI-powered sourcing tools—you give executives the granularity they need to make informed budget allocation decisions. This level of detail transforms a simple cost metric into a strategic planning tool that CEOs can actually use to direct resources toward the highest-ROI hiring channels.
Quality of Hire and Revenue per Employee
If there is one metric that has the power to redefine how executives view recruiting, it is quality of hire. Unlike process metrics that measure speed and volume, quality of hire directly connects recruiting outcomes to business performance. It answers the question that matters most to any CEO: "Are the people we are hiring actually performing?" The challenge, of course, is measurement. Quality of hire is a composite metric that typically combines first-year performance ratings, ramp-up time, retention at 12 and 24 months, and manager satisfaction scores. When presented alongside revenue per employee—a metric already familiar to most CEOs—the connection between recruiting effectiveness and business results becomes undeniable.
LinkedIn publishes annual talent reports that consistently show quality of hire as the top priority for recruiting leaders globally, yet it remains one of the most under-measured metrics in the industry. The reason is simple: it requires cross-functional data that lives outside the ATS. Performance data sits in HRIS systems. Revenue data lives in finance. Manager feedback is scattered across email and survey tools. Building a reliable quality-of-hire metric demands collaboration between TA, HR operations, finance, and business unit leaders. For CEOs, this collaborative effort sends a powerful signal—that recruiting is not operating in a silo but is actively engaging with the business to measure what matters.
The most CEO-friendly way to present quality of hire is through a trend line that shows improvement or decline over time, paired with a correlation to business outcomes. For example, showing that teams with higher quality-of-hire scores also show 15 percent higher quota attainment or 20 percent lower customer churn creates a direct line between recruiting and revenue. This approach transforms quality of hire from an abstract HR concept into a business metric that demands executive attention. When a CEO sees that improving quality of hire by 10 percent correlates with a measurable revenue impact, the conversation about recruiting investment becomes fundamentally different. For TA teams looking to make this leap, understanding the difference between AI sourcing and AI recruiting is critical, as the tools you choose directly influence the caliber of candidates entering your pipeline.
Time to Fill, Time to Hire, and Pipeline Velocity
Time-based metrics are the bread and butter of most recruiting dashboards, but CEOs care about them for a very specific reason: the cost of vacant roles. Every day a critical position remains unfilled, the business is losing potential revenue, overloading existing team members, and risking project delays. Deloitte research on workforce gaps estimates that unfilled positions can cost large enterprises hundreds of thousands of dollars per month in lost productivity and opportunity cost. However, presenting time-to-fill as a standalone number—"our average time to fill is 42 days"—means very little to a CEO. What resonates is framing time-to-fill in terms of business impact: "Every day a sales director position stays open, we lose approximately $15,000 in potential pipeline revenue."
Time to hire, which measures the speed from initial candidate contact to offer acceptance, is a more internally focused metric but serves an important purpose in CEO conversations. It reflects the efficiency of the recruiting process itself—how quickly the team can identify, engage, and close a candidate once they enter the pipeline. A widening gap between time to fill and time to hire signals a problem with the top of the funnel: the team is slow to identify the right candidates, even though the interview-to-offer stage moves quickly. This diagnostic insight helps executives understand whether the bottleneck is in sourcing or in selection, which in turn informs where to invest in technology, process improvement, or additional headcount.
Pipeline velocity is the metric that brings both time dimensions together into a single, actionable indicator. It measures the rate at which candidates move through the hiring pipeline from application to start date, accounting for both the volume of candidates and the speed of progression. A healthy pipeline velocity means the team is generating enough qualified candidates and processing them efficiently. A declining velocity is an early warning sign of systemic problems—whether in sourcing quality, interview bottlenecks, or offer-stage drop-offs. For CEOs, pipeline velocity is attractive because it functions like a leading indicator: it predicts future hiring outcomes before they materialize, giving the executive team time to intervene. This is precisely where agentic AI platforms are changing the game, automating pipeline management in ways that traditional tools simply cannot.
Offer Acceptance Rate and Early Turnover
Offer acceptance rate is a deceptively simple metric—offers accepted divided by offers extended—but it carries significant weight in CEO conversations because it serves as a proxy for employer competitiveness. A declining offer acceptance rate tells a CEO that candidates are choosing competitors over your company, which raises immediate questions about compensation, reputation, and organizational culture. EY regularly highlights talent competitiveness as a top concern for technology executives, noting that offer acceptance rates below 70 percent in competitive markets often signal systemic issues with the employer value proposition.
Early turnover—defined as the percentage of new hires who leave within their first 12 months—is the metric that connects the end of one hiring cycle to the beginning of the next. It is arguably the most expensive hiring metric because it captures the full cost of a failed hire: recruiting expenses, onboarding investment, lost productivity, and the opportunity cost of starting the search over again. For CEOs, early turnover is a stark indicator of hiring quality and organizational fit. A high early turnover rate suggests that the recruiting function is filling seats but not making good matches, which erodes executive confidence in the entire talent acquisition strategy. Presenting early turnover alongside offer acceptance rate creates a powerful narrative: one metric shows whether you can attract talent, the other shows whether you can retain it.
The most effective way to present these metrics to executives is by segmenting them. Offer acceptance rates and early turnover vary significantly by role type, seniority level, and hiring source. A 90 percent acceptance rate for engineering roles paired with a 55 percent rate for sales roles tells a very different story than a company-wide average of 72 percent. Similarly, early turnover that is concentrated among hires sourced through job boards rather than employee referrals points directly to a source quality problem. This segmentation gives CEOs the actionable insight they need to direct resources toward fixing specific problems rather than overhauling the entire recruiting function. It also reinforces the importance of tracking source of hire data meticulously, as the patterns hidden in that data often explain the variance in acceptance and retention outcomes.
Source of Hire and Channel ROI
Source of hire is the foundational metric that underpins nearly every other hiring indicator. Knowing where your best hires come from allows you to allocate budget toward channels that deliver results and away from those that do not. For CEOs, source-of-hire data is the clearest evidence of recruiting ROI. When you can demonstrate that employee referrals produce hires with 25 percent higher first-year performance ratings at half the cost of agency hires, the decision to invest in referral programs becomes self-evident. The challenge is that source of hire is frequently misattributed—candidates often interact with multiple channels before applying, making it difficult to assign credit accurately.
Channel ROI takes source of hire a step further by attaching financial outcomes to each sourcing channel. It answers the question: "For every dollar we invest in this channel, what return do we get?" This calculation requires combining source-of-hire data with cost data and performance data, which is why so few organizations do it well. But for CEOs, this is the metric that justifies or eliminates budget lines. If your job board spend is $200,000 annually and the hires from that channel have an average quality-of-hire score 30 percent below your referral hires, the ROI comparison makes the case for reallocation obvious. Presenting channel ROI as a simple matrix—channel, investment, quality of hire, retention, and estimated revenue impact—gives executives everything they need to make strategic decisions.
The rise of AI-powered sourcing has added a new dimension to channel analysis that CEOs are increasingly aware of. AI sourcing tools can identify and engage passive candidates at a scale that traditional methods cannot match, and the data they generate provides a new source-of-hire category that needs its own ROI calculation. For TA teams, the ability to present AI-sourced hire performance alongside traditional channels is becoming a competitive differentiator in executive conversations. The companies that can demonstrate that their AI sourcing investment produces higher-quality, faster-to-hire, and longer-retaining talent are the ones winning larger recruiting budgets. Understanding how to properly evaluate these tools—whether you are comparing AI-native platforms against legacy ATS add-ons or assessing full-cycle recruiting automation—is essential for building a source-of-hire narrative that resonates with the C-suite.
Building a CEO-Ready Recruiting Dashboard
The difference between a TA dashboard and a CEO-ready dashboard is not complexity—it is clarity. A recruiting team's internal dashboard might include fifteen to twenty metrics with drill-down capabilities and real-time updates. A CEO-ready dashboard includes no more than ten carefully chosen indicators, each one connected to a business outcome, and presented in a format that can be consumed in under five minutes. The design philosophy is simple: every metric on the dashboard must answer the question, "Why should the CEO care?" If a metric cannot be linked directly to revenue, cost, risk, or competitive positioning, it does not belong in the executive view. This discipline in curation is what separates recruiting teams that get executive investment from those that get budget cuts.
The structure of a CEO-ready dashboard typically follows a logical flow that mirrors how executives think about the business. It starts with outcome metrics—quality of hire, early turnover, and revenue per employee—that establish whether hiring is working. It moves to efficiency metrics—cost per hire, time to fill, and pipeline velocity—that reveal whether the process is operating effectively. And it closes with strategic metrics—offer acceptance rate, source of hire ROI, and diversity of hire—that indicate whether the function is building sustainable competitive advantage. This narrative structure guides the executive through a complete story, from "Are we getting results?" to "Are we getting them efficiently?" to "Are we building for the future?"
Technology plays a critical role in making this dashboard a reality. Most ATS platforms were not designed for executive reporting, which means TA teams often need to supplement their core systems with business intelligence tools or purpose-built analytics platforms to create the CEO-ready view. The key requirement is the ability to pull data from multiple sources—ATS, HRIS, finance, and performance management systems—into a single unified view. Without this integration, the dashboard will always be incomplete, and CEOs will continue to see recruiting as a data-poor function. Investing in the right analytics infrastructure is not a nice-to-have; it is a prerequisite for the kind of executive-level reporting that transforms recruiting from a cost center into a strategic business partner.
Turning Metrics into Boardroom Conversations
Having the right metrics is only half the equation. How you present them determines whether they drive action or get ignored. CEOs do not have time to interpret complex charts or dig through layered reports. They need a clear, concise narrative that connects hiring data to business outcomes and ends with a specific ask. The most effective TA leaders present their metrics in a three-act structure: here is where we stand, here is what the data tells us, and here is what we need to move forward. This narrative approach transforms a data dump into a strategic conversation, and it positions the TA leader as a business thinker rather than a process manager.
Timing and context matter enormously in executive conversations. Presenting hiring metrics during a quarterly business review, when the CEO is already thinking about performance and strategy, is far more effective than scheduling a standalone recruiting update. Tying your metrics to the business themes the CEO is already focused on—whether that is entering a new market, launching a product, or managing through a downturn—ensures your data feels relevant rather than tangential. For example, if the company is expanding into Europe, presenting data on time-to-fill for European roles alongside competitive market analysis positions recruiting as a strategic enabler of the growth plan rather than a back-office function waiting for requisitions.
Finally, the most underutilized strategy in executive reporting is benchmarking against competitors and industry standards. A CEO who sees that your quality of hire is improving by 5 percent quarter over quarter might be mildly encouraged. But a CEO who sees that your quality of hire is 15 points above the industry average and 20 points above your closest competitor—that commands attention. External benchmarking data from organizations like Gartner, McKinsey, and SHRM provides the context that turns internal metrics into competitive intelligence. When you can show a CEO not just how hiring is performing, but how it is performing relative to the market, you elevate the conversation from operational reporting to strategic advantage.